|
Financial Professionals Summer 2019
This is my quarterly missive intended primarily for my fellow financial professionals wherein I share items I have run across or thought about this quarter which I think might be beneficial to you. Enjoy!
First, I’m sure you are aware the “Secure Act” has been unanimously reported out of a house committee. Some version of this looks likely to become law. Michael Kitces had a weekend wrap-up that started with the bill (based on the WSJ article here). Here are the main items (quotes mostly from Michael’s summary but in one instance the WSJ article itself):
- “eliminating the current age cap (70½) for contributing to a traditional IRA”
- “increase the age at which RMDs begin to 72 (up from 70½)”
- “requiring employers to disclose to employees on their 401(k) statements the amount of sustainable monthly income their balance could support”
- “making it easier to convert employer retirement plans into lifetime annuities to fund that monthly income amount”
- “creating the potential for Multiple Employer Plans (MEPs) for multiple small businesses to group together into a single 401(k) plan for cost efficiencies”
- “allowing up-to-$5,000 of penalty-free distributions from retirement accounts to cover birth/adoption expenses”
- “allow long-term part-time workers to participate in 401(k) plans”
- “allowing tax-free withdrawals of up to $10,000 from a 529 college savings plan to repay student loans”
- “repealing the 2017 change to the Kiddie Tax that caused unearned income of children to be taxed at the trusts-and-estates tax brackets”
- “a proposal that would largely eliminate the “stretch IRA” rules for retirement accounts and instead require inherited account balances to be distributed within 10 years of death”
My friend Jason Lina had a good write up here as well.
Second, financial success mostly isn’t a function of income (as I expounded on here), and this article makes the same point:
Having a higher salary doesn’t necessarily mean money woes are behind you, with nearly one in 10 workers making $100,000 or more (9 percent) saying they usually or always live paycheck-to-paycheck and 59 percent in that income bracket in debt. Twenty-eight percent of workers making $50,000-$99,999 usually or always live paycheck to paycheck, 70 percent are in debt; and 51 percent of those making less than $50,000 usually or always live paycheck to paycheck to make ends meet, 73 percent are in debt.
Jonathan Clements points out that higher income doesn’t help happiness either:
What if incomes rise, so the rest of us start enjoying the standard of living previously enjoyed only by the wealthy? Society grows no happier, because there are always those who feel relatively shortchanged.
This was confirmed yet again by the latest General Social Survey. In 2018, 31% of Americans said they were very happy, barely higher than the 30% who described themselves that way in 1972, when the General Social Survey was first conducted. Yet, over this 46-year stretch, U.S. inflation-adjusted per-capita disposable income rose 131%. We’re living more than twice as well as we were in 1972, but apparently we’re no happier.
What does lead to happiness? Einstein observed, “A calm and modest life brings more happiness than the pursuit of success combined with constant restlessness.”
Lack of resources probably leads to unhappiness though (being broke is stressful!), and “The bottom half of Americans combined have a negative net worth.” (source)
Third, the length of the bull market/economic expansion in the US continues to worry many people who mistakenly think that the length of an expansion is the measure of risk. It isn’t. (It’s the relationship of prices to fundamentals that increases risk.) Anyway, one factoid that I have known for a long time but never thought to use in this type of discussion is the length of time Australia has gone without a recession. Australia hasn’t had a recession since 1991 (source). And Japan’s GDP is lower now than it was in 1994 (source). The point is that we generally don’t realize that the “business cycle” isn’t a regular process at all. This is why we diversify. Now there are nuances like Australia’s per capita growth has experienced downturns during that time (they have had high immigration levels which helps – note to Trump administration), and Japan’s growth is positive in inflation-adjusted terms (because they have had deflation). But still, I think people don’t realize the amount of variation in things like this.
But Barron’s agrees with me, so now I’m worried I’m wrong …
Fourth, there were a number of items about value investing that I thought worth sharing: Morningstar, Alpha Architect, Reformed Broker, and Barron’s, which noted:
The valuation spread between the cheapest and most expensive stocks in the Russell 1000 index recently hit its widest point in nearly 20 years, says Nomura Instinet. By some measures, it’s the widest in history.
I also wrote last time about definitions of value and Factor Research put this out. Here is the key chart:

Fifth, Investment News had an article, “IBDs with the most CFPs” which was annoying in two ways: 1) It is a slideshow which inflates their pageviews but then it can’t be simply scanned for the info, and 2) they rank firms by count instead of percentage. That can be useful, but I was more interested in the percentage data.
Firm |
#Reps |
#CFPs |
%CFPs |
Commonwealth Financial Network |
2,258 |
961 |
42.6% |
Securities America Inc. |
2,600 |
701 |
27.0% |
Securian Financial Services Inc. |
1,111 |
221 |
19.9% |
Cambridge Investment Research Inc. |
4,155 |
806 |
19.4% |
Waddell & Reed Financial Advisors |
1,403 |
257 |
18.3% |
Raymond James Financial Services Inc. |
6,433 |
1,068 |
16.6% |
Kestra Financial Inc |
1,943 |
308 |
15.9% |
HD Vest Investment Services |
3,700 |
561 |
15.2% |
Northwestern Mutual Investment Services |
7,892 |
1,190 |
15.1% |
AXA Advisors |
4,757 |
422 |
8.9% |
Total |
36,252 |
6,495 |
17.9% |
So, Commonwealth Financial and (to a lesser extent) Securities America are well above average on having credentialed reps and AXA is an outlier on the other end. In the original data (sorted by CFP count) it looked like Northwestern was a planning shop, but they are second from last by percentage.
Sixth, this is completely off topic so feel free to move to the next item unless you share my pedantic interest in language. (By the way, from the early 1980’s on I really enjoyed reading a few newspaper columns in particular: William Safire’s “On Language” column, James J. Kilpatrick’s “The Writer’s Art” column, and William F. Buckley’s erudite columns on anything. I also got an education from Lewis Grizzard’s columns, but he’s in a different category. I miss those guys. Looking back, I realize I was fortunate that when I was a youngster, we always got a newspaper with good syndicated columnists.)
Anyway, there are two words and a phrase that are perfectly fine but that I can’t use anymore because most everyone else is confused about them:
- Forte – I can use this in print, but if I use it correctly when speaking (to refer to someone’s strength), people think I’m ignorant. That’s because the correct way to pronounce it is like “fort” not like “for-tay.” “For-tay” is the correct pronunciation for the word forte when you are using it in the musical sense (it means loud) because there it comes from the Italian. For referring to someone’s strong suit, the word is from the French and should properly be pronounced “fort” (but the proper usage is being lost, so many dictionaries say either is proper – but as William F. Buckley once said about conservatives, I’m standing athwart history yelling “Stop!”). So I can either hold the line on proper usage and look dumb or give in to popular opinion. Those who know me well know that the second option isn’t one I would ever take. I choose neither and just avoid saying the word completely.
- Niggardly – this means cheap or parsimonious. It has no relationship etymologically with that other word you are thinking of, but because because of the similarity, it can no longer be used.
- Steep/shallow learning curve – I never see this used correctly and if I use it correctly it confuses people. The reference is to a graph where time (or effort) is on the x-axis and proceeds from left to right. The y-axis represents the amount learned or skill acquired. That is a totally straight-forward way to represent a change through time. But if the line goes up sharply that means you progressed quickly. So, a steep learning curve means it was easy to learn/progress. A shallow learning curve means you spent a bunch of time/effort and made little progress.
I’m sure there are more items in this category, but those occur to me right now.
Seventh, from Ben Carlson:
On a recent episode of How I Built This with Guy Raz, Butterfield [billionaire co-founder of Flikr and founder of Slack] was asked how this enormous wealth has impacted his life. He told Raz, “beyond a certain level of wealth it doesn’t make your life any better.”
He went on to list what he considers to be the three levels of wealth:
Level 1. I’m not stressed out about debt: People who no longer have to worry about their credit card debt or student loans.
Level 2. I don’t care what stuff costs in restaurants: How much you spend on a particular meal isn’t impacted by your finances.
Level 3. I don’t care what a vacation costs: People who don’t care how expensive the hotel is or which flight they go on.
Eighth, we are all (hopefully) in learning organizations; here (or here) is a very good piece on effective learning that was mentioned in the WSJ. One of the co-authors is now GM of the Houston Rockets.
Ninth, make sure you are preparing to provide higher-end, creative solutions to your clients or your business is at risk.
Tenth, this quarter I answered a question on the FPA message boards about a book recommendation for clients. I thought I would share my $0.02 with you all also. We keep four books on hand to give away:
- Winning the Loser’s Game - to disabuse people of stock picking, market timing, etc. strategies
- The Four Pillars of Investing - for the few people who really want to go in-depth
- Total Money Makeover - for people who have debt issues (generally not our clients)
- The Millionaire Next Door - for people who aren’t saving enough relative to their high incomes
(Note on Dave Ramsey: IMHO he is very good on getting out of debt, and *ahem* less good at everything else related to financial planning; my mention of his book should not be construed as agreeing with him on anything other than consumer debt is mostly bad and people should generally get out of it.)
We also gift The Way to Wealth to young people graduating high school and The Curmudgeon’s Guide to Getting Ahead to those graduating college.
Eleventh, I always think of asset protection and ancillary probate issues (items one and five in this article), but there are three other reasons given to hold vacation homes in an LLC.
Twelfth, as I’m sure you know, the 2005 bankruptcy act made the creditor protection on employer plans unlimited (401(k), 403(b), SEP, Simple, etc.) – even if balances were rolled into an IRA. It also created a federal bankruptcy exemption for IRAs of $1,000,000 plus an inflation adjustment every three years. We just passed the three year period and on 4/1/19 the limit was increased to $1,362,800. It got me thinking, since all rollovers are unlimited, and the limits are on direct IRA contributions are pretty low (and were even lower historically) is it even possible to hit the limit?
Let’s suppose our taxpayer made the maximum contribution every year since the inception of the IRA. IRAs started in 1975 with a $1,500 limit and the catch-up was instituted in 2002 for folks over 50. So, if our hypothetical person was at between 23 and 26 in 1975, he or she can still be making contributions (70 or younger now) and could have made the maximum catch-up contributions as well. Here is the history:
Year |
Base Limit |
Catch up |
Total Contribution |
1975 |
$1,500 |
$0 |
$1,500 |
1976 |
$1,500 |
$0 |
$1,500 |
1977 |
$1,500 |
$0 |
$1,500 |
1978 |
$1,500 |
$0 |
$1,500 |
1979 |
$1,500 |
$0 |
$1,500 |
1980 |
$1,500 |
$0 |
$1,500 |
1981 |
$1,500 |
$0 |
$1,500 |
1982 |
$2,000 |
$0 |
$2,000 |
1983 |
$2,000 |
$0 |
$2,000 |
1984 |
$2,000 |
$0 |
$2,000 |
1985 |
$2,000 |
$0 |
$2,000 |
1986 |
$2,000 |
$0 |
$2,000 |
1987 |
$2,000 |
$0 |
$2,000 |
1988 |
$2,000 |
$0 |
$2,000 |
1989 |
$2,000 |
$0 |
$2,000 |
1990 |
$2,000 |
$0 |
$2,000 |
1991 |
$2,000 |
$0 |
$2,000 |
1992 |
$2,000 |
$0 |
$2,000 |
1993 |
$2,000 |
$0 |
$2,000 |
1994 |
$2,000 |
$0 |
$2,000 |
1995 |
$2,000 |
$0 |
$2,000 |
1996 |
$2,000 |
$0 |
$2,000 |
1997 |
$2,000 |
$0 |
$2,000 |
1998 |
$2,000 |
$0 |
$2,000 |
1999 |
$2,000 |
$0 |
$2,000 |
2000 |
$2,000 |
$0 |
$2,000 |
2001 |
$2,000 |
$0 |
$2,000 |
2002 |
$3,000 |
$500 |
$3,500 |
2003 |
$3,000 |
$500 |
$3,500 |
2004 |
$3,000 |
$500 |
$3,500 |
2005 |
$4,000 |
$500 |
$4,500 |
2006 |
$4,000 |
$1,000 |
$5,000 |
2007 |
$4,000 |
$1,000 |
$5,000 |
2008 |
$5,000 |
$1,000 |
$6,000 |
2009 |
$5,000 |
$1,000 |
$6,000 |
2010 |
$5,000 |
$1,000 |
$6,000 |
2011 |
$5,000 |
$1,000 |
$6,000 |
2012 |
$5,000 |
$1,000 |
$6,000 |
2013 |
$5,500 |
$1,000 |
$6,500 |
2014 |
$5,500 |
$1,000 |
$6,500 |
2015 |
$5,500 |
$1,000 |
$6,500 |
2016 |
$5,500 |
$1,000 |
$6,500 |
2017 |
$5,500 |
$1,000 |
$6,500 |
2018 |
$5,500 |
$1,000 |
$6,500 |
2019 |
$6,000 |
$1,000 |
$7,000 |
So, if those were the contributions each year, and now the balance is the bankruptcy protection limit of $1,362,800, what rate of return would our hypothetical person have earned? 9.58%
The stock market has averaged 11.9% over that period, so it isn’t impossible, but I think it is pretty rare that someone would be over the limit.
Thirteenth, one of my consulting clients sent me this along with the comment “pretty insightful.” I replied:
I liked the article. Thanks for forwarding. I agree with all the philosophical points made, but I’m less certain about the skew and kurtosis. Using CRSP total US stocks from 1926 to 2018, I get these statistics for monthly data:
Monthly |
Total US Market |
Log Returns |
Avg. |
0.92% |
0.78% |
Sigma |
5.28% |
5.28% |
Skew |
0.13 |
-0.56 |
Kurt |
7.54 |
6.73 |
There are certainly fat-tails (excess kurtosis) in monthly returns, but the skew is basically zero on the raw returns. The market is, in theory, log-normally distributed (and certainly is over longer periods), which means that the skew should be positive for the “regular” returns and zero for the log returns, but for one-month (and one-year, below) periods, you can see that it looks pretty normal.
And for calendar years (you can’t use rolling 12-month without corrections, which I’m not going to take the time to do):
Annually |
Total US Market |
Log Returns |
Avg. |
11.66% |
9.30% |
Sigma |
19.83% |
19.27% |
Skew |
-0.41 |
-1.00 |
Kurt |
0.08 |
1.35 |
A little negative skew, but no fat tails on the regular (not log) returns.
Despite the data above, all the MCS software (to my knowledge) assumes log-normal distributions (including mine), but the difference isn’t large in annual data.
Fourteenth, last year I sent my consulting clients info on the lifetime medical spending of retirees in the form of a summary from NBER of a paper but another summary from the Richmond Fed just came out that goes into a little more detail.
Fifteenth, just like I send things to you all, I send things to my college-student daughter (yes, I’m aware that it sucks to be my kid – there’s a lot of “suggested” reading). I recently sent her the following and thought you might like it too. It all applies to investing and financial planning.
Good (short) article; my restatement of/dilation on the key skills:
- The ability to recognize how true something is, is independent of how much you want it to be true. Really wanting Trump or Hillary to be guilty of a crime shouldn’t affect your assessment of the odds that they did commit a crime, but most people let their feelings skew their perspective – a lot. More practically, the degree to which you want a particular course of action to work out doesn’t change the odds that it will. Wishing doesn’t make it so. Really wanting a particular job, grade, significant other, etc. doesn’t improve the odds of it happening (unless mediated by work). Napoleon Hill, Norman Vincent Peale, etc. are wrong. Thinking something can happen, may, in some cases, be necessary for it to happen, but it is almost never sufficient.
- Respectfully interacting with people you disagree with. A rare skill today and arguably one of the most important ingredients in a liberal arts education. This is why the leftist groupthink that is permeating campuses is a problem. I don’t care if kids are liberal or conservative, Christian or atheist, etc. but they should be able to take alternative viewpoints seriously and engage with them on the merits rather than just shouting them down and demanding a safe space and censorship.
- The ability to have a 10-minute conversation with anyone from any background. Another key ingredient of your liberal arts education hopefully. Can you interact – as a peer – with both the kitchen/janitorial workers and your professors?
- Getting to the point. Being able to succinctly – yet persuasively and clearly – get your point across.
- Diplomatically saying “No.” Self-explanatory.
- Understand that “luck” is just the distributions of outcomes from risk. If you consistently have good (or bad) luck vs. your expectations, your risk model is wrong (not adequately fitted to reality). Success comes from having an accurate view of the world and having agency to be an effective actor in that world.
Sixteenth, there was a question about a client’s risk tolerance posted on the FPA message boards recently that prompted a good discussion. Here is my contribution to that thread:
There have been a number of good responses on this topic, but I thought it might be helpful to go “up a level” to a more theoretical view.
“Risk tolerance” is too undefined and that is why you may get conflicting answers.
There are three separate components to risk tolerance:
- Risk capacity – can the client financially afford to take the risk?
- Risk propensity – what is the client’s attitude toward risk? Will they be able to sleep at night? This is the factor that is measured (or attempting to be measured) by the risk tolerance questionnaires. This attitude pretty stable through time too (though on average it trends down with age), which is nice.
- Risk perception – do they recognize the risk? do they feel like stocks are more or less risky right now than “normal”? This factor is absolutely not stable through time (investor’s perceptions of investment risk were very high at the market lows of 2008, their perceptions of real estate risk were very low in 2006, etc.).
I suspect that third factor may be the issue here. What I use for “risk tolerance” is pretty simple: “During a normal, periodically-expected market decline (not the great depression, but periods such as 1973-74, 2000-02, and late 2007 through early 2009) we expect the risky portion of your portfolio to decline by about half. The risky portion is everything that is not investment-grade bonds or cash. So, Mr. Client, since you have $1,000,000 portfolio and you are invested 90/10 that implies that a decline to $550,000 would be normal - how do you feel about that?” [90/10 was roughly the portfolio in the original scenario being discussed.]
Seventeenth, I ran across a good life expectancy calculator here.
Eighteenth, you probably saw the blockbuster (valuation) Goldman Sachs/United Capital deal. Using the data here and here, I did some calculations:
|
Firm Totals |
Sales Price to |
Per Rep |
Per Office |
Per Client |
Sales Price |
$750mm |
na |
$3.4mm |
$8.3mm |
$34,000 |
AUM |
$25b |
3.0% |
$114mm |
$278mm |
$1.14mm |
Revenue |
$230mm |
3.26 |
$1,045,000 |
$2,556,000 |
$10,500 |
Earnings |
$42mm |
17.85 |
$191,000 |
$467,000 |
$1,900 |
Reps |
220 |
$3.4mm |
na |
2.4 |
na |
Offices |
90 |
$8.3mm |
na |
na |
na |
Clients |
22,000 |
$34,000 |
100 |
244 |
na |
Fee% |
0.92% |
na |
na |
na |
na |
Profit Margin |
18.3% |
na |
na |
na |
na |
Nineteenth, I saw two insightful quotes. The first is not specifically finance related, but very good:
If you raise your children, you spoil your grandchildren. If you spoil your children, you raise your grandchildren.
The second was from Morgan Housel:
Savings is the gap between your ego and your income.
Twentieth, I saw a good listing of Estate Planning Risks and an excellent Estate Planning & Tax Glossary list of topics that experienced financial advisors will already know, but it’s a great resource for new advisors or those just starting a CFP course of study. If I were still teaching the CFP fundamentals module, I would give this to the class as a reference and suggest they familiarize themselves with it before hitting the tax and estate planning modules.
Twenty-first, there was a very good paper that examined the conflicts of interest we all face.
Twenty-second, I saw recently saw Vanguard’s 10-year asset class predictions:
Ten-year projected return ranges
U.S. equities: 4.0%-6.0%
U.S. aggregate bonds: 2.5%-4.5%
International equities: 7.5%-9.5%
International bonds (hedged): 2.0%-4.0%
You might think their predictions are too high, or too low, or whatever, but I think most people wouldn’t think anything at all of the range they gave. In other words, a 10-year projection of compound returns with a 2% range seems reasonable – but what has the actual range of returns been? I looked at all the rolling 10-year average historical annual returns (every month from 1926 to 2018, so not independent runs, which is technically a no-no, but I’m trying to make a simple point not write a technical paper). Here are the stats for the U.S. stock market, 5-year treasuries, and CPI, all from 1926 to 2018:
|
Total US Market |
5YR Treasuries |
CPI |
Mean |
10.26% |
5.35% |
3.35% |
Sigma |
5.26% |
2.98% |
2.36% |
Min |
-5.25% |
1.17% |
-2.64% |
Max |
20.36% |
13.73% |
8.81% |
You will remember that roughly 68% of observations lie within one standard deviation (and 95% within two), so the historical one standard deviation ranges were:
|
Total US Market |
5YR Treasuries |
CPI |
1σ High |
15.53% |
8.33% |
5.71% |
1σ Low |
5.00% |
2.37% |
0.99% |
Range |
10.53% |
5.96% |
4.72% |
Historically 68% of the time you weren’t within 2% of the mean on inflation, never mind stocks or bonds!
Now, you can certainly tighten up the range (particularly with fixed income) by using valuations (which is undoubtedly what they have done), but 2% CAGR range over 10-years for stocks is still a ridiculously small range IMHO.
So, let’s get some valuation metrics in here. Here is the CAPE vs. the subsequent 10-year return on the S&P 500 (overlapping rolling returns):
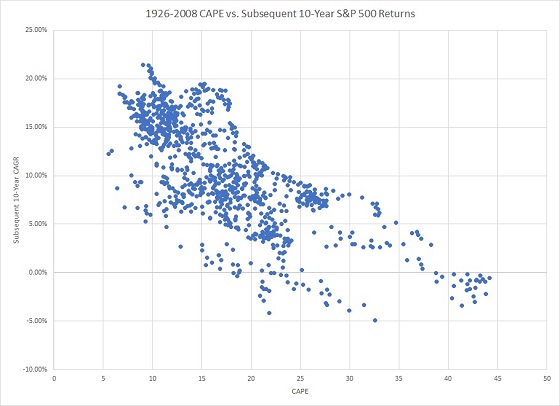
There isn’t any place on that chart where the vertical distance (subsequent 10-year range of returns for a given CAPE) is anywhere close to a 2% spread! Just eyeballing it, it looks like roughly a 10-15% spread unless you are at very high valuation levels (which may just be the result of very few observations). The current CAPE is 29, when the CAPE is between 28 and 30 (a few months each in late 2001/early 2002, late 1996/early 1997, and in 1929) the subsequent range of returns has been -3.94% to +8.42%, a spread of 12.36% – certainly not 2%.
I like Vanguard, but they appear to have way too much confidence in the precision of their forecasts, or (more likely) if they came out with an honest prediction and said the range was -4% to +9% (the range should be wider than the history since what we have is just a sample) they would probably be ridiculed, or the forecast dismissed as useless. But that’s the real range!
Twenty-third, there was an excellent exposition of oversold life insurance premium financing here.
Twenty-fourth, can you find an active manager with skill? Probably not.
Twenty-fifth, I thought this graph was interesting:

Twenty-sixth, any mutual fund that doesn’t open an affiliated ETF that is a share class of the fund in 2023 (when Vanguard’s patent expires) is guilty of malfeasance. You can make any fund perfectly tax-efficient (except for yield) through asset swaps with other parties (as explained here and here). It will be interesting to see if that strategy is eliminated by the IRS (by rule) or Congress (by law), or if the law is changed to allow reinvested gains in a mutual fund to defer gain recognition also (so parity in treatment with ETFs), or if the tax dodge just persists. I can’t handicap this one at all as far as possible outcome.
Twenty-seventh, there was a discussion on the NAPFA message board about the stupidity of putting a variable annuity inside an IRA. I posted (lightly edited):
I think, that in a way, putting an annuity in an IRA is actually better! It at least clears up what the client is usually actually attempting to purchase – some sort of guarantee. Variable annuities usually make taxes worse, not better (but it depends on the portfolio, time horizon, etc.) vs. a taxable account. A VA (without riders, outside an IRA) is the equivalent of a non-deductible IRA – but with higher costs.
I have a calculator where you can solve for the annuity breakeven vs. a taxable account. Assuming you are doing asset location correctly already, it is unusual to have the annuity make sense in a low interest rate environment or for low-turnover equities.
Calculator here: Tax Treatment Comparison Spreadsheet
Full blog post on asset location here: Asset Location Strategy
And a blog post on Variable Annuities vs. Taxable Accounts for anyone interested: Variable Annuities vs. Taxable Accounts (the example no longer exactly matches the calculator because I overhauled the calculator recently and made it more accurate, and 2% misc deductions are obviously gone now, etc.).
Twenty-eighth, there was also a discussion on “income investing” where I chimed in:
Income investing is suboptimal in general (and many years* out of date on portfolio theory). It may make clients feel better (like “bucket strategies” and “dollar cost averaging”), but it has little empirical support (once adjusted for factor weights since it correlates with value). In theory, it may reduce agency costs, but portfolios are much less diversified and frequently less tax efficient (depends on account type and spending/rebalancing patterns). Our policy is to coach/educate clients into having well-constructed portfolios rather than indulge their predilections for silly strategies.
*1952 Markowitz MPT paper has expected (total) return vs. risk, no axis for “income”; in 1961 Miller and Modigliani showed dividend policy is theoretically irrelevant to expected return; in 1974 Black and Scholes demonstrated it empirically.
Twenty-ninth, good post on which asset bubble was the GOAT (Greatest Of All Time).
Thirtieth, I periodically post this, but it’s been a while. Breakeven inflation (to justify TIPs) and breakeven marginal tax brackets (to justify munis) both continue to be pretty darn low:
Maturity |
TSYs |
TIPs |
Munis |
BE Inflation |
BE Tax Rate |
5yr |
1.78% |
0.22% |
1.34% |
1.56% |
24.72% |
10yr |
2.03% |
0.32% |
1.62% |
1.70% |
20.20% |
30yr |
2.56% |
0.78% |
2.40% |
1.77% |
6.25% |
Thirty-first, I am not a crypto-currency fan so I enjoyed the very funny (and true) observations from Matt Levine:
The thing about crypto/blockchain mania is that there may never have been a more general-purpose episode of mass credulity. It’s not just that a lot of people think they can get rich quick on crypto, it’s that they think crypto can solve all of the world’s problems, that it can end famine and stop climate change and save journalism and cure cancer and bring peace to the Middle East.
Still there is more work to be done, in terms of setting up and raising money for crypto startups to propose implausible blockchain solutions to comically large problems. If I set up a crypto startup to prove the existence of God on the blockchain, do you think I can get a meeting with the pope? If I set up a crypto startup to build a perpetual motion machine on the blockchain, will the Department of Energy meet with me? If I set up a crypto startup to travel faster than the speed of light, on the blockchain, can I pitch it to NASA? If I set up a crypto startup to develop time travel on the blockchain, can I show it to Benjamin Franklin?
Honestly why am I wasting my time writing this column. I bet if you Google these you’ll find someone is already doing like half of them; I thought I was kidding about “cure cancer” and there are multiple pages of search results. Here’s “opioid epidemic.” Really almost anything you can think of. Blockchain really can do anything, or at least raise money for promises to do anything, so where is my share of that money?
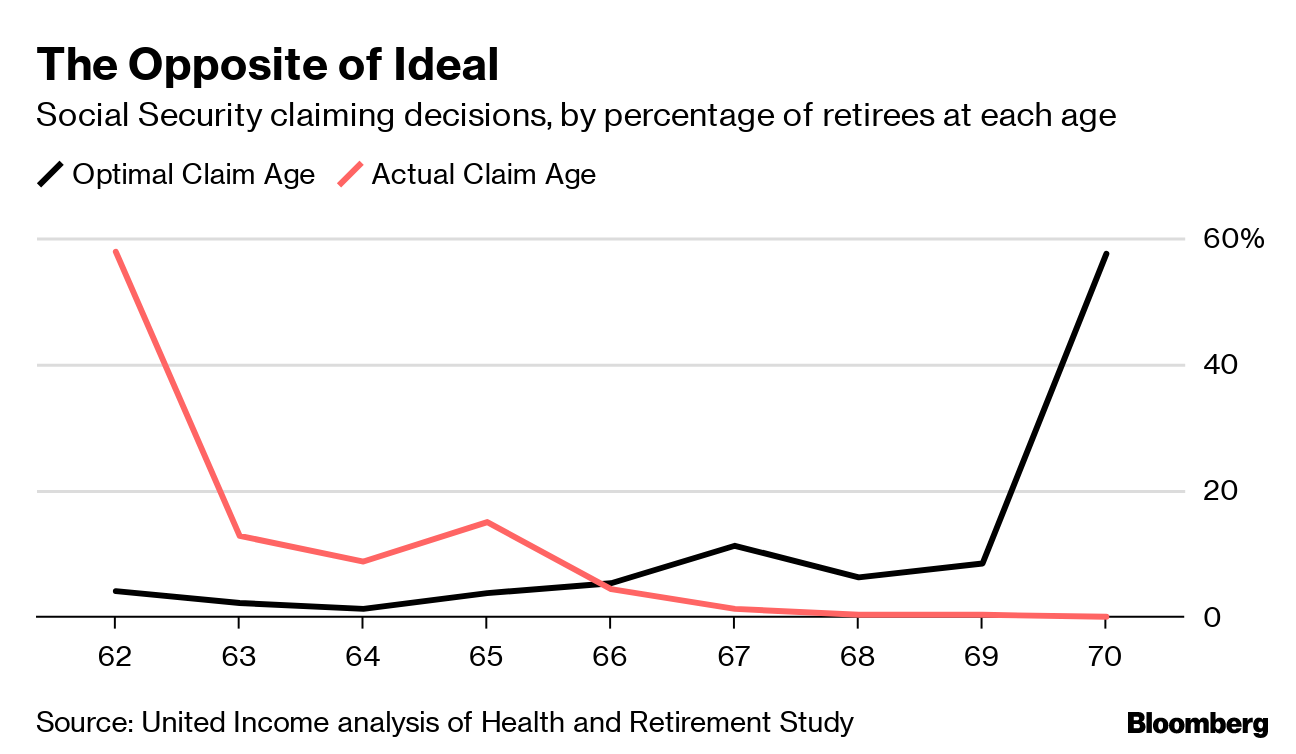
Thirty-second, people are still claiming Social Security inefficiently:
Thirty-third, indexing capital gains for inflation is apparently under consideration. I think there are actually four related changes that would make sense (I’m doing logic, not necessarily what would save us or our clients the most money):
- Good changes for taxpayers:
- Index gains for inflation as already mentioned.
- Defer tax for reinvested gain distributions from on mutual funds (this would also give them parity with ETFs which can easily avoid recognizing gains).
- In exchange for all that:
- All gains are taxed at ordinary rates (so all types of return have parity)
- No step-up in basis on death (so there is no more “lock in” waiting for a death to get a step-up before assets are can be reallocated more efficiently)
Finally, my recurring reminders:
J.P. Morgan’s updated Guide to the Markets for this quarter is out and filled with great data as usual.
Morgan Housel and Larry Swedroe continue to publish valuable wisdom. Just a reminder to go to those links and read whatever catches your fancy since last quarter.
That’s it for this quarter. I hope some of the above was beneficial.
Addendum:
If you are receiving this email directly from me, you are on my list of Financial Professionals who have requested I share things that may be of interest. If you no longer wish to be on this list or have an associate who would like to be on the list, simply let me know.
We have clients nationwide; if you ever have an opportunity to send a potential client our way that would be greatly appreciated. We also have been hired by some of our fellow advisors as consultants to help where we can with their businesses. If you are interested in learning more about that arrangement, please let us know.
We also offer a monthly email newsletter, Financial Foundations, which is intended more for private clients and other non-financial-professionals who are interested. If you would like to be on that list as well, you may edit your preferences here.
Finally, if you have a colleague who would like to subscribe to this list, they may do so from that link as well.
Regards,
David
Disclosure
|
