|
This is my quarterly missive intended primarily for my fellow financial professionals wherein I share items I have run across or thought about this quarter which I think might be beneficial to you. Enjoy!
For the rest of 2018 I have seminars for CPAs scheduled (through Surgent) in Georgia (Atlanta and Duluth), and North Carolina (Greensboro, Charlotte, and Morrisville).
I would love to see you at one of those sessions, and if you are looking for a speaker at your professional conference or event, please feel free to contact me for more information.
First, I have ranted written a lot about overconfidence over the years. But I think the focus is justified because I believe our biggest blind-spots and problems stem from that one root cause.
About 15 years ago I was thinking of writing a book on behavioral finance and my working title was Ignorance, Myopia, & Hubris: Financial Planning Mistakes People Make. Roughly 100% of the folks I shared that title with thought it was terrible – my purchasers would end up being roughly 3 academics and my mom.
But, the reason I had that tentative title was I thought all behavioral finance anomalies were really manifestations of one or more of those issues, either people don’t know something relevant, or they are too short-sighted, or they are too overconfident. Ignorance can be fixed with education. Myopia probably can’t be fixed at all (e.g. I don’t know how to get people who rack up consumer debt and don’t save anything to change their ways). I am cautiously optimistic that education can fix hubris too. I don’t think we will stop hubris, but perhaps we can recognize it and thus dampen the pernicious effects.
For example, we will probably always feel like we can stock-pick and market-time, but hopefully we will recognize we are deluding ourselves and refrain from acting on those impulses.
Anyway, HBR has a recent article showing how those who know a little, but only a little, about something are the most overconfident. This is similar to the Dunning-Kreuger Effect I have mentioned many times.
Second, I also saw a mention of overconfidence here. There are three books we keep in the office to give away:
- The Total Money Makeover: A Proven Plan for Financial Fitness by Dave Ramsey for people who desperately need fundamental help with debt and budgeting. We don’t take these folks as clients because 1) it isn’t our business model, and 2) I suspect the good doctor is right. [Note: I don’t think Dave Ramsey is at all valuable for people whose financial lives are in reasonable order, his motto seems to be “I couldn’t handle debt, so you shouldn’t have any.” Furthermore, his financial planning advice is biased (referrals to generally low-quality, commission-driven “advisors” who pay him referral fees) or ignorant (no, the U.S. stock market isn’t going to earn 12% a year and you probably shouldn’t put your entire portfolio in it). But for people drowning in debt he might be helpful – to the extent the good doctor is wrong.]
- Winning the Loser’s Game: Timeless Strategies for Successful Investing by Charles Ellis for people who want to explore the (compelling, I think) argument for passive investing.
- The Four Pillars of Investing: Lessons for Building a Winning Portfolio by William Bernstein for people who want to understand more about rational investing in general.
The link in the first sentence is to Jonathan Clements’ recent blog post where he talks about Bernstein’s book and mentions overconfidence:
But he [Bernstein] also notes that isn’t easy. “We tend to be overconfident not just about our investment abilities, but also about our ability to tolerate risk.”
Also, at Financial Architects we persistently overweight TIPS in portfolios compared to other advisors (although I prefer to think of it as all the other advisors being massively short unexpected inflation in their bond allocations). Jonathan quotes Bernstein on that topic to close his post:
“If you look at financial history, the biggest threat by far is hyper-inflation,” says Bernstein. “For short-term protection, the best place is TIPS. For long-term protection, it’s stocks, because they’re a claim on real assets.”
Third, I saw this story and the title caught my attention, “A Brass Sculpture Could Deliver a 1,400,000 Percent Return for Heirs” but you should always annualize, and this investment was held for a long time (63 years). Still impressive though, assuming it sells for the estimated $70,000,000:
($70,000,000/$5,000)^(1/63)-1=16.4%
But note that BRKA still beats even that:
($296,000/$19)^(1/54)-1=19.6%
Also, those heirs must be happy that the step-up in basis hasn’t gone away. The rate on collectibles is 28% so just the federal income taxes would have been almost $20 million.
Fourth, I got a query about Blockchain investing from a client (an occupational therapist) via email, “I have read some important papers on this new technology. Is there a company who owns the most solid position in this area? Are they reputable, publicly traded etc. I see huge, long-term benefits on this technology.”
I thought my response to her might be of interest (lightly edited):
That is a great question. I agree with you that blockchain technology is going to be huge (I’m less sure about cybercurrencies). I can easily foresee stock exchanges removing the clearing functions that currently exist because the blockchain can record ownership. Also, property records can be put on blockchain (eliminating registrars and the need for title insurance), and I’m sure there are uses that haven’t even occurred to anyone yet. But, it is more complicated to invest profitably in the sector.
This is going to be a longish response (Anitha does the short ones, I drone on), but it really is a good question – thanks for the opportunity to pontificate.
To profit from new technology is harder than first appears. There are two ways to profit:
First, you can recognize the technology revolution – but if everyone recognizes it, then all the investment opportunities are already at least fully valued, if not overvalued (people tend to get carried away). So you must recognize a new technology has enormous potential while others don’t see it. That is difficult to say the least.
Second, you can figure out which company is going to be the winner in the gold rush. Again, you must be better at predicting than everyone else. Another extremely difficult challenge.
History is replete with life-changing technologies, but in virtually every case, investors (in aggregate) lost money trying to pick the winners (though of course a lucky few made fortunes). Examples include the railway mania of the 19th century, the automobile industry in the early 20th century, the PC revolution in the early 1980’s, the dot com and internet boom of the late 1990’s, etc.
Railroads and cars might not seem like cutting-edge technology like blockchain, but they certainly were at the time.
As Wikipedia notes, “There were over 1,800 automobile manufacturers in the United States from 1894 to 1930. Very few survived.” Even Henry Ford’s first attempt failed.
So, while I agree the technology is likely to be huge in the future, I would avoid investing in it. It is much more likely to be overvalued than undervalued.
One sign that the investment opportunities in this space may be experiencing excessive enthusiasm is that even occupational therapists want in on the action! :)
But even if we could overcome all the things I mentioned, there really isn’t a good “reputable, publicly traded” way to invest. If you wanted to do so (and Anitha & I looked at investing personally last year and decided against it) I would buy half Bitcoin (because it is most prevalent it should benefit from network effects), and half Ether (i.e. Ethereum, because I think the smart contracts infrastructure is the big deal, not necessarily the currencies, and they currently have the best platform).
Fifth, Vanguard has an updated new piece out that emphasizes the importance of the relationship side of our businesses. See page 15 in particular.
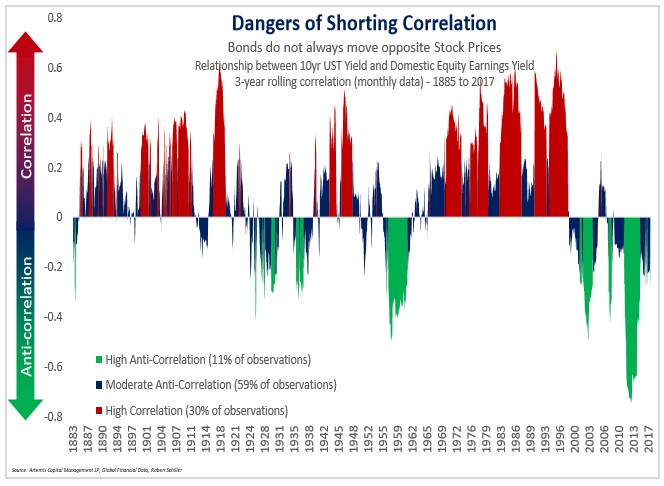
Sixth, one of the folks on this list asked about using floating rate debt for some fixed income – reducing duration risk but picking up return from credit risk. I replied, “I actually prefer the opposite because credit risk is positively correlated with equities, while duration risk is negatively correlated.”
He sent me this chart that has apparently been going around (though I hadn’t seen it):
That prompted me to dig up some data (not cherry-picked, this is the very first data I thought to look at). Here are the three most recent poor stock market periods and the cumulative nominal performance of stocks and bonds:
Top |
Bottom |
#Months |
|
5Yr
TSY |
Correl
w/ Stocks |
LT Gov’t |
Correl
w/ Stocks |
Dec-72 |
Sep-74 |
21 |
-45.1% |
4.9% |
-23.7% |
-6.0% |
0.4% |
Aug-00 |
2-Sep |
25 |
-44.9% |
27.5% |
-67.4% |
28.5% |
-53.2% |
7-Oct |
9-Feb |
16 |
-50.2% |
15.6% |
-26.9% |
16.0% |
11.8% |
Avg |
|
20.67 |
-46.7% |
16.0% |
-39.3% |
12.8% |
-13.7% |
As you can see high credit quality of whatever duration helped significantly when you needed it most. I wouldn’t draw any conclusions about which duration is “better” based on that small sample, if there is an increase in inflation as well as a market downturn then short bonds will be better, otherwise long bonds will likely be better.
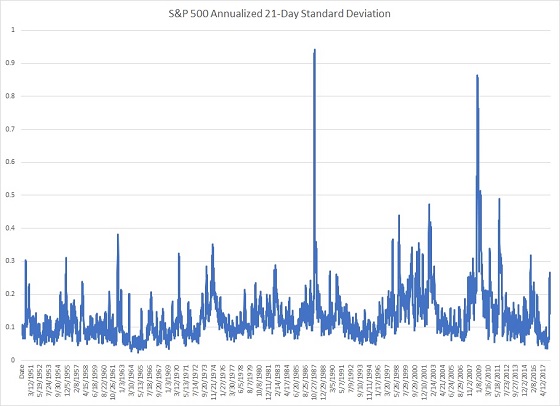
Seventh, is Jack Bogle getting senile? He said: “I have never seen a market this volatile to this extent in my career. Now that’s only 66 years, so I shouldn’t make too much about it, but you’re right: I’ve seen two 50-percent declines, I’ve seen a 25-percent decline in one day and I’ve never seen anything like this before.”
So Jack, in his dotage, is apparently losing it. Here is the annualized, rolling 21-day volatility (so roughly monthly) of the S&P 500 up to when the article was published:
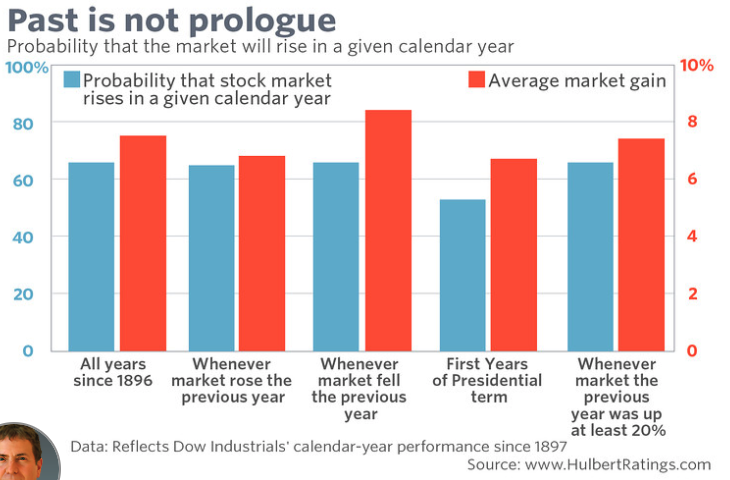
Eighth, there aren’t patterns:
Ninth, Ben Carlson did a great job here debunking the myth that individual bonds are better than bond funds.
Tenth, here is a very good overview of Fiduciary Principles in Trust Law, most people don’t realize how difficult the issues are.
Eleventh, I attended a “Future of Finance” conference a while back and two speakers had comments I thought worth sharing. I didn’t get down exact quotes, so everything below is my version of their points.
First, Carl Richards (the “sketch guy” of behavior gap fame):
- Ask prospects this question, “Why is your money invested the way it is?” Most people have no idea.
- “Clients don’t care about your solutions – they care about their problems.”
- “Clients don’t want you to be smart – they want you to listen.”
Carla Harris (see “about the author” here) explained that people say they want/need a mentor, but more precision would be helpful. There are three different roles, from least to most important, they are:
- Advisor – someone you can ask a specific question of and they will give you a good answer. Fact-based answers.
- Mentor – someone who will give you advice tailored to your specific situation. This person may or may not be in your organization. Wisdom-based answers.
- Sponsor – someone who will promote and advocate for you. This person must be in your organization, be exposed to your work, and have “juice”.
Twelfth, I recently went to a “speed-dating with wholesalers” event in San Diego. I do this periodically to listen to and learn about investment philosophies, products, etc. that I wouldn’t ordinarily listen to. In short, I worry about confirmation bias. It also gets me in different conversations where I think of things prompted by the conversation.
I asked most all the folks I met (after hearing their pitch) if the fund had a statistically significant t-stat. Not only did they not know, none of them had ever heard of such a thing!
So, the most fundamental metric for knowing whether an effect is “real” or just random luck is not used in our industry!
I’ll give an example from medicine and then from investing.
Suppose you are a pharmaceutical company with a new drug and you want to know whether it works. You could give it to one person and see how they did, but that would (obviously) be meaningless. So science has converged on a process:
- Have a treatment group that gets the drug in question and a control group that gets either a placebo or the current “best” drug.
- Ideally have the study double-blind (neither the patients or the doctors gathering the data on outcomes know which group got the drug or the placebo).
- Compare the outcomes of the two groups statistically (using a difference of means test) so see if there is a meaningful difference. (By convention, if there is only a 5% chance the difference was luck it’s considered meaningful, i.e. statistically significant.)
In investing, the “control group” is usually an index. I had lunch with a wholesaler a few months ago who was very excited about a real estate fund they had. I asked about the t-stat, he didn’t know what that was but went back to get it. He forwarded info from their portfolio manager that claimed:
Our Alpha t-stat since inception is 2.10, so the t-stat is significantly different than 1.98 (t-crit for ~120 observations). This calculation is pulled from Morningstar and uses our benchmark (FTSE EPRA/NAREIT Developed Net) and monthly returns since inception (10/1/2007-2/28/18).
Of course, I’m skeptical, so I look at it and reply to the wholesaler:
Sorry, not even close unless I made an egregious error somewhere (let me know if I did). The best fit index (per Morningstar) is S&P Global REIT TR USD. The correlation with [ticker redacted to protect the guilty] is 96.3% (per me), so that is an outstanding benchmark.
The monthly alpha to that benchmark is just 1 bp with a standard deviation (tracking error) of 166 bps so very little signal compared to lots of noise (IR of 0.0067).
This means the t-stat is just 0.074. That, in turn, means there is only a 5.9% probability that the fund is different (two-tailed test) from the benchmark. Certainly not enough for a 94 bps expense ratio.
He didn’t point out any error on my part, so I think I did it right.
Thirteenth, I was thinking about how optimizing wins until it loses. There is a natural tendency for things to become increasingly adapted to their environments and with this adaptation to be more and more successful. These successful entities (organisms or companies) grow larger and larger – until.
Until the environment changes. There is a trade-off between specialization and adaptability. The more successful an entity is in one environment, the less successful it will be in another. The bigger the “bet” you make the better you do when it works, but the worse you do when it doesn’t.
The sweet spot is somewhere in the middle. You never want to go “all in” on the current environment, but neither do you (probably) want to maintain perfect flexibility.
This applies to career choices as well. One of the highest paid college degrees is petroleum engineer, one of the lowest is liberal arts (but philosophy majors do better than you might think). But what if the world changes? Again, there is a trade-off between specialization and breadth. The petroleum engineer’s career is high return and high risk like a stock portfolio, a liberal arts major is more like a bond portfolio, their career is likely to be (financially) unspectacular, but their downside is likely lower (given equal intelligence, etc. – I’m not sure the average liberal arts major has the same qualities as the average engineer, but in this analysis, I am assuming the same student merely selected one or the other and had the ability to be academically successful in either major). The best combination is probably a technical (STEM) degree with a minor in liberal arts. Or maybe a liberal arts degree with a technical graduate degree.
In portfolio construction, this means you overweight what has worked (equities, factor-tilts, etc.) but you always remember the future could be different, so you prudently diversify too (investment grade bonds, no factor tilts, etc.).
Probably the best way to hedge an unknown future is to use as little leverage as possible in your business, personal finances, etc.
Let me give a few examples of specialized careers which have higher risk/return (stocks) vs. more generalized careers that have lower risk/return (bonds) in spaces adjacent to ours:
An estate planning attorney who specializes in sophisticated estate tax avoidance strategies makes much more than one who does general wills & trusts – until the estate tax limit is raised so high that few people have estate tax problems.
Similarly, an insurance agent who specializes in very large second-to-die policies to offset estate tax liabilities makes more than an agent who sells a broader range of policies – until the estate tax limit is raised so high that few people have estate tax problems.
A securities attorney who specializes in litigation against advisors who have sold inappropriate products makes more than one who focuses more broadly on say fiduciary litigation in general (advisors plus trustees, executors, etc.) – until the market goes a decade without a major downturn.
A few more that haven’t happened here yet:
What if you focus on tax prep and the government starts doing the return for taxpayers? (as in Denmark, Spain, and Sweden)
What if you focus on college funding strategies and higher education becomes free (to the student of course, not the taxpayers)? (as in Finland, Germany, and Norway)
What if you specialize in health insurance and we adopt a universal healthcare system? (as in essentially every other industrialized country)
What if you focus on income tax strategies and we adopt a flat tax or consumption tax so there aren’t any strategies? (ok maybe that will never happen)
So what about our businesses? How about:
A financial advisor who just does simple retirement projections and uses model portfolios or third-party money managers (which scales nicely) makes more than one who does broader personal financial planning (which doesn’t scale) – until “robo” advisors provide the same (or better) service at much lower cost.
I’m not saying any of those approaches is wrong, just that people don’t seem to think about possibility that the landscape can change. Survival of the fittest depends on the environment, being perfectly fit for an environment is better than fitness for lots of environments – until the environment changes. I would note that this overspecialization is a bigger risk for the young since the amount of future change that can happen is greater over a longer period.
Similarly, this article parallels how I think about financial planning and portfolio construction. Wealth management is an “infinite game” – survival is more important than getting the highest score. Thus, you should not (completely) optimize for the current situation because the current situation may not persist, and we don’t know in what ways it could be different.
Fourteenth, per Shachar Kariv, there are three fundamental tradeoffs, “All decisions in life – large and small, financial or not – are governed by what I call the three fundamental trade-offs: risk versus return, today versus tomorrow, and self versus others.”
Fifteenth, I heard Bob Veres speak at the FPA Regional Symposium here in Atlanta. He had some good observations on what excellent customer service is:
- Setting clear expectations (and then exceeding them)
- Being responsive to client requests (returning phone calls promptly, following up to be sure they got the check, etc.)
- Creating enjoyable interactions (your least-well-paid staffer may be your most important “ambassador” to clients and prospects)
- Providing high-quality professional advice
- Exhibiting exemplary conduct and character
- Visibly caring about clients’ well-being
Clients value availability, compassion, and ability (expertise) in that order – and clients generally cannot evaluate your expertise.
These points are from his new book, The New Profession, which only appears to be available on his web site.
Sixteenth, great tweet from Jim O'Shaughnessy:
I don’t know how the market will perform this year. I don’t know how the market will perform next year. I don’t know if stocks will be higher or lower in five years. Indeed, even though the probabilities favor a positive outcome, I don’t know if stocks will be higher in 10 yrs.
Seventeenth, good rule of thumb on bankruptcy I hadn’t seen before:
If your unsecured debts are less than 60 percent of your net annual pay, avoid bankruptcy. Commit 20 percent of your net pay to pay past creditors. Most creditors will wait two or more years if you show good faith and make systematic payments. Many more will settle for less. Consider bankruptcy only if you cannot completely eliminate your debts within three years.
Eighteenth, I thought I wrote up how to estimate expected inflation previously, but if I did I can’t find it, so here it is.
The market’s estimate of inflation can be derived simply from the spread of “regular” (nominal) treasuries and TIPS (treasury inflation-protected securities). As I write this, the 30-year treasury is at 3.20% and the 30-year TIPS is at 1.03% (per Bloomberg). So, very simplistically, inflation is expected to average 2.17% (the difference). That is slightly off though in three ways:
First, it doesn’t matter much at the current low rates, but subtraction isn’t technically correct. The returns on nominal bonds are given by this formula: (1 + yield) = (1 + real rate) * (1 + expected inflation) * (1 + risk premium)
Since we are talking about treasuries, the risk premium is (supposedly) zero so that term drops out. We can rearrange the remaining terms thus: (1 + inflation) = (1 + nominal yield) / (1+ real rate)
Plugging in the current rates we have: (1 + inflation) = 1.0320/1.0103 = 1.0215
Subtracting 1 from both sides, we are left with 2.15% as the inflation expectation. As I said, very close to just subtracting at these low rates.
Second, since TIPS are slightly less liquid than nominal treasuries we would expect a small liquidity premium (much like the difference between on-the-run treasuries and off-the-run treasuries). In other words, the TIPS yield is a little higher due to being less liquid which means expected inflation is actually a little higher than the spread would indicate.
Third, since TIPS eliminate inflation risk, buyers should be willing to pay a small premium to avoid that risk. In other words, the TIPS yield is a little lower due to having less risk which means inflation is actually a little lower than the spread would indicate.
My astute readers will have noticed that the previous two items go in opposite directions, so they offset each other. They are also difficult to estimate and are likely small in magnitude. In practice that means I ignore them.
Here is a table for the different maturities (again per Bloomberg) where I have computed the expected inflation column from the other two columns using the formula given earlier:
Term |
Nominal Yield |
TIPS Yield |
Expected Inflation |
5-Year |
2.89% |
0.74% |
2.13% |
10-Year |
3.06% |
0.90% |
2.14% |
30-Year |
3.20% |
1.03% |
2.15% |
Nineteenth, I’m sure you are familiar with the strategy of “bunching” charitable contributions for folks who are charitably inclined, but who might not itemize other than that (or even despite that). Obviously, the new tax law makes the strategy applicable to a much larger number of people. For example, suppose someone is MFJ with no mortgage. Other than their $10k of SALT they may well have no itemized deductions other than whatever charitable gifts they make – and if those gifts are less than $14k each year they will get no tax deduction for them. Suppose they regularly donate $10k/year to their place of worship – would it make sense (perhaps using a DAF as a holding vehicle) to donate $20k every second year (getting a $6k deduction)? $30k every third year (getting a $16k deduction)?
I was curious how many years should be bunched. I think it is a function of the following:
- How much the taxpayer “normally” gives.
- Their marginal tax bracket.
- Their discount rate (they must come up with more cash initially to do the strategy).
- How far they are from itemizing (if they would itemize even without the charitable contribution they needn’t – and shouldn’t – bunch).
Here is a spreadsheet which shows the NPV of the strategy for various levels of bunching and discount rates.
Yellow cells are the inputs. Discount rates are after-tax so think munis, not t-bills, for rates.
Using my previous example, with a 30% marginal tax bracket, and a 5% discount rate (which I think might be high), the taxpayer should do charitable contributions 8 years ($80k) at a time.
Other considerations and issues:
- Less wealthy charitably-inclined clients tend (I think) to look at it in terms of dollars/year, as in, “I give (or want to give) $X/year to Y charity.” More wealthy clients may think of donations of large lump sums periodically. This calculator is more applicable to the less wealthy.
- There is of course uncertainty as to future tax rates which is virtually impossible to handicap, but I think the risk goes both ways. Marginal rates could go up, marginal rates (not taxes maybe, but rates) could go down (perhaps in conjunction with a VAT for example). Two years ago who would have predicted the lower tax rates that now exist?! (English really needs an interrobang.) Of course the client’s situation can vary too so this is just like trying to figure out whether and how much of a Roth conversion to do. There is a proposal in Congress now to move the charitable deduction above the line for everyone so that would mean doing “extra” now for an additional deduction was a waste (or perhaps worse if you have something being phased-out based on AGI in the future).
- I’m not sure at this point what discount rate is “right” but it is an interesting question. Let me generalize a little bit which may make it clearer. I think it might be easier to think about an expense other than charitable giving. A client can prepay an expense. The expense is not large relative to their net worth. For example, a gym membership where you can pay annually (less) or monthly (cumulatively more). What is the cost of capital that should be used to figure out whether to do it or not? I can think of four possibilities plus four possible adjustments/other factors.
- Hurdle Rates:
- The return on their checking or savings account because they now carry a lower balance.
- The return on a short-term bond fund because it is short-term “investment.”
- The HELOC rate because they now carry a higher balance.
- The expected return on their portfolio – i.e. what their 60/40 is expected to do. I don’t think this is right because the risk is different, but it is a possibility and would be analogous to the WACC for a company I suppose.
- Adjustments/Other Factors:
- Convenience – I might prefer to pay the gym annually rather than monthly to simplify my checkbook balancing or avoid potential late fees if I forget (online banking may have made this issue largely moot).
- Optionality – I might prefer not to pay the gym annually because I might change my mind or want to go to a different gym. On the other hand, in this specific example, I might want to incent myself to go – it’s the sunk cost fallacy, but it seems to work for many folks. So the optionality value could conceivable be negative.
- Risk – I might prefer not to pay the gym annually because I might get injured, move, etc. so it could be wasted.
- Forced saving – I might prefer my checking/savings balance look lower, so I don’t spend the money on other consumption or unwise purchases. Or discourage spouse from same.
The calculation – here is the intuition behind the spreadsheet:
- We want the present value of the difference between donating $X every year vs. doing it in lumps when we are $D distance from itemizing. For ease of calculation let’s assume someone is:
- $10k from itemizing (e.g. $14k of non-charitable deductions for MFJ)
- they would normally give $15k/year
- we want to know the value of bunching 5 years
- with a discount rate of 5%
- and a marginal tax bracket of 24%
- In year one the incremental value is:
- An outflow of $60k (four extra years at $15k each)
- An inflow due to the incremental tax deduction of $14,400 ($60k*24%)
- So the net cash flow in year one is an outflow of $45,600
- In the subsequent years (4 in this case) the value is:
- An “inflow” (really just less expense) of the $15k they aren’t donating
- An “outflow” of $1,200 (the $5k they would have been over the standard deduction at a 24% tax rate)
- So the net cash flow in subsequent years is an inflow of $13,800 (again it’s really a lower expense, but that is the same as an inflow to the household)
- The PV of a payment of $13,800 for four years at 5% is $48,934 [=PV(0.05,4,13800) in Excel]
- $48,934 minus $45,600 is $3,334. I.e. the present value of bunching in this case is $3,334.
Twentieth, the TCJA (the Tax Cuts and Jobs Act from December) had a provision I missed initially.
Up until 2009 the cost basis of an insurance policy was considered to be the total net premiums (i.e. premiums reduced by loans, dividends received, etc.). That gave rise to a tax scam opportunity. Suppose you paid $10,000/year for 30 years in premium for a permanent policy and it was surrendered for the cash value of $400k. The basis would be $300k so the gain (ordinary, not capital) would be $100k. As I said, that was the way everyone understood it to work until 2009 when the IRS took the position that the basis should be reduced by the “cost of insurance” in the case of a life settlement. In other words, suppose a 30-year term policy with the same coverage would have cost $4,000/year. Essentially what you paid for the insurance part was $120,000 so that is an expense and not basis. (On economic grounds I believe the IRS was right.) Anyway, that would mean the basis in our example would be $300k - $120k = $180k so there would be a gain of $220k on the sale of the policy (an “extra” $120k over how it worked previously).
Not only did this cause higher taxes to the seller of a policy, but it required figuring out what the pure cost of insurance would have been. There was no good way to do this, insurance companies didn’t even have a way to retroactively determine that (or they just didn’t want to).
Anyway, TCJA overturned Revenue Ruling 2009-13 and restored the previous rule that the basis is the total net premiums paid.
Now what I want is a term policy that terminates with $1 of cash value. Suppose a 20-year term policy had a premium of $1,000/year. At the end of the 20 years, the total paid would have been $20,000. I would then do a 1035 exchange of the dollar to an annuity. That annuity now has a basis of $20,000 with a value of $1 so the first $19,999 of growth is tax free. For example, add another $100,000 investment into the annuity, and the first 20% of gain is tax-free (and the annuity should probably be cashed out as soon as the value reaches $120k and the free gains are gone).
Twenty-first, there was a good article from the FAJ here. No new information really, but a good reminder of things people sometimes forget about correlations in the real world. When I teach classes that cover diversification, I make three points:
- Diversification into many different risky assets is important in good times because you don’t know in advance which asset will go up the most.
- Diversification into safe assets (treasuries for example) is important in bad times because all the risky assets will tend to decline together.
- Diversification provided by “non-traded” assets is illusory – it’s just an artifact of estimated, rather than real, prices.
Those are covered in the article. In addition, the article also makes a further point that led me to a clearer view of risk: In general, when risky assets (stocks) decline the safe assets (treasuries) are a diversifier, but when safe assets decline risky assets decline as well.
Twenty-second, I was thinking that we all go through four stages of competence:
- Unconscious Incompetence – we don’t know enough to even know we are incompetent (Dunning Kruger Effect)
- Conscious Incompetence – we know enough to recognize our incompetence (Socrates: “The only thing I know is that I know nothing.”)
- Conscious Competence – we know we are competent, but we realize how difficult it is to be so
- Unconscious Competence – we are competent, and can’t imagine how someone could remain incompetent when it is so simple
So how does this apply to investing? I think people go through the same four stages (if they progress):
- “Investing is easy – just buy the investments that are obviously going to go up.” (And, as Will Rogers said after the 1929 crash, “if they don’t go up, don’t buy them.”)
- “Investing is hard – I have no idea what is going to go up.”
- “Investing is hard – I’ll just give up and buy everything (index).”
- “Investing is easy – why doesn’t everyone see the obvious, that due to the arithmetic of active management they would be better off if they just indexed?”
Twenty-third, The CFP course materials that cover the exam body of knowledge mention 457 plans, but it is cursory and generally doesn’t explain that there are two types. (Exam questions revolve around 1) the “special” catch-up provision, and 2) the ability to “double-dip” and contribute to a 401(k), IRA, etc. as well, regardless of AGI.)
The IRS has a good comparison though here.
Twenty-fourth, “[T]he purpose of investing is to maximize returns, not minimize boredom.” – Morgan Housel (source)
Twenty-fifth, I don’t remember seeing this Larry Swedroe piece on performance chasing even though it came out a while back (the paper he mentions is here).
The fact that the signal-to-noise ratio of the data is very low over the time periods most people evaluate is very important to keep in mind. I made a similar point here:
We have calculated that if a manager has outperformed his or her benchmark by 2% per year on average (a 2% alpha is huge), 56 years of data would be required to know with confidence he or she was actually better (not 2% better – just better at all) and that it wasn’t just luck (assumes 90% correlation and 20% standard deviation).
The study Larry Swedroe references is an even better explanation of the problem though I think.
Twenty-sixth, I read a paper on marginal costs. Interestingly, it appears that the conventional wisdom may be wrong – costs may be relatively constant as a percentage of revenue, not declining as commonly assumed. In other words, economies of scale may be illusory.
The firms in this paper are much larger than our practices, nonetheless, I have always assumed our profit margins are relatively constant regardless of growth – that our increased earnings come from, and are a fixed percentage of, revenue.
In an interesting financial planning application, I think it may also be true at the individual household level. In other words, some households consume 75% of annual earnings, others 90%, and some 110%. In other words, some save 25%, some save 10%, and others spend more than they make. If true, and I think it is though I can’t prove it, the level of household income is related to the level of savings, but not to the savings rate (percentage). (There is some data, households that are “empty nesters” predict – ahead of time – that their savings rate will increase now that expenses for offspring are lower. The evidence is that their savings is little changed, but other consumption increases.)
Twenty-seventh, as you read apocalyptic stories on the future of Social Security, some historical perspective might be helpful.
Twenty-eighth, I recently posted on a financial planning message board in a thread about considering the PV of SS as an asset on the balance sheet of the client (lightly edited):
It can be enlightening to do a “full” (aka “extended”) balance sheet, but in practice it takes some work. When I taught the CFP capstone course I would usually have the class work through an example because it usually points out how little of a middle-class retired client’s net worth is invested in stocks – items not in the portfolio are usually bond-like).
There are three primary “off-balance sheet” items to consider:
- SS, which can be considered an investment in TIPs
- Pensions, which can be considered an investment in nominal bonds
- Human capital (for clients still in the workforce), which is a hybrid of stocks and TIPs (for most people the TIPs element is predominant)
The calculations can be complicated. For example, since this thread is on SS, I will walk through the computation of the present value of just one year of SS.
Assume opposite sex married clients, both currently age 65, both higher SES (socioeconomic status - so the life expectancy is a little longer). The monthly SS benefits are $1,500 and $2,000 (in today’s dollars). It doesn’t matter which person has which benefit since the survivor gets the higher of the two.
Let’s find the PV of those payments just for the year of benefits received at age 85. It won’t matter if they are currently taking or plan for one to wait until 70, etc. since we are using today’s values from the SS statement for the correct claiming age (or the amount they are currently receiving).
First, if both are alive the nominal value is $3,500*12= $42,000, if only one is alive the nominal value is $2,000*12=$24,000. Using a mortality table (like this one) and looking up the odds of white collar individuals we see that the odds of both alive are 40% and only one is 46% (there is a 14% chance that no one is alive).
So the expected payment at age 85 is $42,000 * 40% + $24,000 * 46% = $27,840.
Finally, we discount 20 years to get today’s balance sheet value. Since the payment is inflation-adjusted and government-guaranteed, we should use the TIPs yield curve to do this. The yield on 20-year TIPS (per Bloomberg) is 0.79%, So the PV is $23,786 ($27,840/(1.0079^20)).
Repeat that calculation for every year from now (age 65) until past age 100 (at some points the expected values get small enough you can stop) and add all the results. (You will have to extrapolate the TIPs yields for many of the years.) This isn’t too hard in excel but will probably take an hour or so the first time you do it.
The computation of a pension is similar, but use nominal bonds (unless the pension has a COLA). If you believe the federal gov't will bail out the PBGC (if necessary) use treasuries for the rates below the PBGC guaranteed levels, use the company’s corporate bond rates for the portion (if any) above the PBGC limit (this builds in default risk).
For human capital, you should discount at a blend of stocks and TIPS (as noted above) but determining the expected stock returns to all the different years is prohibitively difficult (and certainly outside the scope of this post). If the client has robust life insurance and disability insurance, you can reasonably ignore mortality and morbidity risks to the human capital, so that helps simplify.
Finally, for younger clients discounting SS is complicated by the issues that 1) there should be some political risk adjustment (I wouldn’t worry about a 65 year old much and just use TIPS, but a 35 year old is a different story), and 2) there aren’t TIPS with maturities longer than 30 years so you will have to extend the returns past where you actually have yield curve data (the curve seems relatively flat at that point so this isn’t a big deal). To deal with risk, I would just increase the TIPS rate by 1% over actual. This means the further out the benefit the higher the discount, so it accounts for the political risk (though of course I just made up a 1% risk factor with no real justification other than it seems roughly correct).
I wouldn’t (and we don’t) do this for every client, but it can be helpful sometimes to see what their actual extended balance sheet looks like.
(See here for much more on this and similar topics.)
Thought you might find it of interest.
Finally, my recurring reminders:
J.P. Morgan’s updated Guide to the Markets for this quarter is out and filled with great data as usual.
Jonathan Clements, Morgan Housel, and Larry Swedroe, all continue to publish valuable wisdom. Just a reminder to go to those links and read whatever catches your fancy since last quarter.
That’s it for this quarter. I hope some of the above was beneficial.
Addendum:
If you are receiving this email directly from me, you are on my list of Financial Professionals who have requested I share things that may be of interest. If you no longer wish to be on this list or have an associate who would like to be on the list, simply let me know.
We have clients nationwide; if you ever have an opportunity to send a potential client our way that would be greatly appreciated. We also have been hired by some of our fellow advisors as consultants to help where we can with their businesses. If you are interested in learning more about that arrangement, please let us know.
We also offer a monthly email newsletter, Financial Foundations, which is intended more for private clients and other non-financial-professionals who are interested. If you would like to be on that list as well, you may edit your preferences here.
Finally, if you have a colleague who would like to subscribe to this list, they may do so from that link as well.
Regards,
David
Disclaimer: The information set forth herein has been obtained or derived from sources believed by author to be reliable. However, the author does not make any representation or warranty, express or implied, as to the information’s accuracy or completeness, nor does the author recommend that the attached information serve as the basis of any investment decision. This document has been provided to you solely for information purposes and does not constitute an offer or solicitation of an offer, or any advice or recommendation, to purchase any securities or other financial instruments, and may not be construed as such. |
