|
This is my quarterly missive intended primarily for my fellow financial professionals wherein I share items I have run across or thought about this quarter which I think might be beneficial to you.
If you are looking for a speaker at your professional conference or event and think I might be a good fit, please feel free to contact me for more information. I spoke a few weeks ago at the FPA of North Alabama and they made a short video clip.
First, here is a good article. Don’t be put off by the title, it really isn’t about quantitative investing, and there are very good nuggets of information and wisdom scattered throughout.
Second, here is a great piece from Cliff Asness explaining some concerns with the at-least-temporarily-postponed fiduciary rule. I concur.
My preference would have been for regulation to follow one (or both) of the following approaches:
- Many years ago, brokers had to call themselves brokers or registered representatives. Only Registered Investment Advisers could call themselves advisers (or advisors). Broker’s are by definition not advisors (any advice is deemed “solely incidental” to their job of sales). I don’t know how you take the “solely incidental” part of your job and make that your title. I’m not sure when this changed, but I had “Registered Representative” on my first business cards in the late 80’s.
- Make disclosure of total compensation (direct and indirect) mandatory. I think a huge section of the insurance industry in particular would change overnight (as the non-traded REIT industry is right now) with mandatory disclosure of compensation.
Third, it may seem obvious that stocks outperform t-bills, but actually, they don't on average, only collectively! (Because positive skewness of the winners…) An academic paper explaining this peculiar state of affairs can be found here.
Fourth, Robert Shiller had an interesting paper on the importance of narrative in driving economic behavior. In other words, the stories that “catch on” may have real effects on the market and the economy. But I wanted to share a portion of the paper talking about oil prices and production. I have made the point many times that there is almost never a true energy crisis (IMHO of course) because technology wins in the long run. Resources have been running out since Malthus (An Essay on the Principle of Population, 1798) but don’t actually ever run out. Here are the quotes (from page 30):
An article by W. W. Woods in the Los Angeles Times in September 1920 said: “In the last two years the growing appetite of the internal combustion engine for gasoline has been more than six times what it was in 1901.” He concluded that the nation’s oil supply would be exhausted in eighteen years. Moreover, coal prices were high in late 1920, and retail stores of coal for home furnaces were reportedly exhausted as winter approached. Clayton (2015) documents the history of this narrative, from Teddy Roosevelt’s 1908 White House conference on exhaustion of resources, to even more dire predictions by May 1920 from David White, chief geologist at the USGS, that oil production would peak “probably within five years and possibly in three years.”
Seem familiar? Plus ça change, plus c'est la même chose…
Fifth, this is a must read to get caught up on where we are (and have been) on factor investing. The best one-article synopsis of the research that I have seen.
Sixth, If you look at booms (extreme upward moves) in the stock market, the odds of a crash following aren’t really different from non-booms. Essentially, what people call bubbles are simply the subset of booms that subsequently corrected sharply, but those aren’t common. In other words, the fact that stocks have moved up sharply isn't particularly useful information. (Valuations are a slightly different story.) Similarly, if stocks have moved down sharply that isn't useful information either, other that the subsequent returns are more likely to be extreme – but the direction is uncertain.
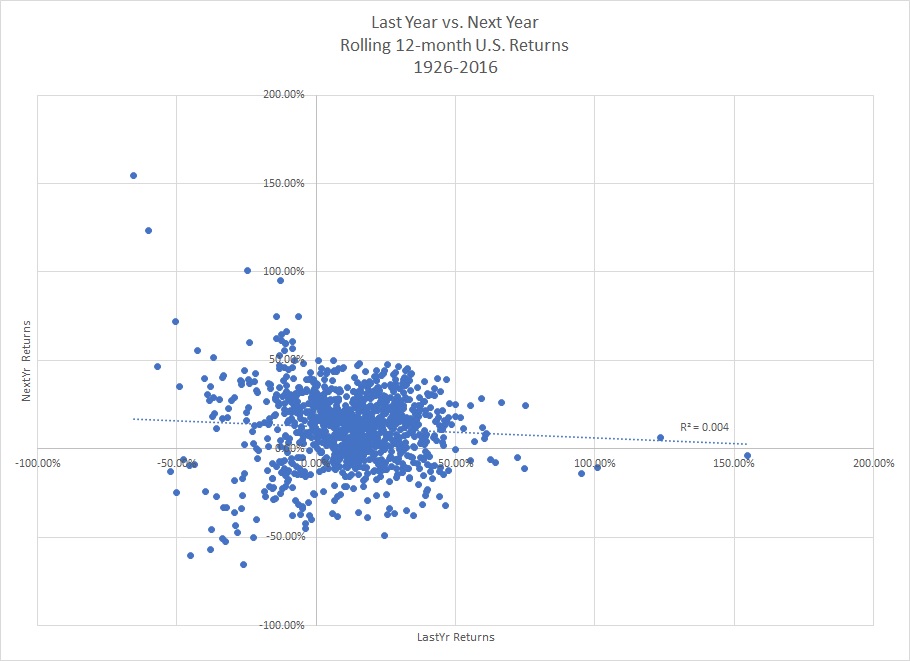
For U.S. stocks (CRSP 1-10) for all 12-month periods from 1926 to 2016 I plotted a scatter chart of the trailing 12-months performance (x-axis) and the subsequent 12-months performance (y-axis):

(Click the image for a larger version.) As you can see, the data looks pretty random, and the R^2 of the best-fit line is trivial. You will notice on the left (when the prior returns were very poor) the dispersion of the next returns are high (i.e. the range on the y-axis is very high).
For example, the 12-months ended June 1932 had a return of negative 65.42%, which was followed by a return of 154.60% over the next 12 months (still -6% annualized). Conversely, 12 months ended May 1931 had a return of negative 45.27%, which was followed by a return of -69.35% over the next 12 months (-53% annualized over the two periods).
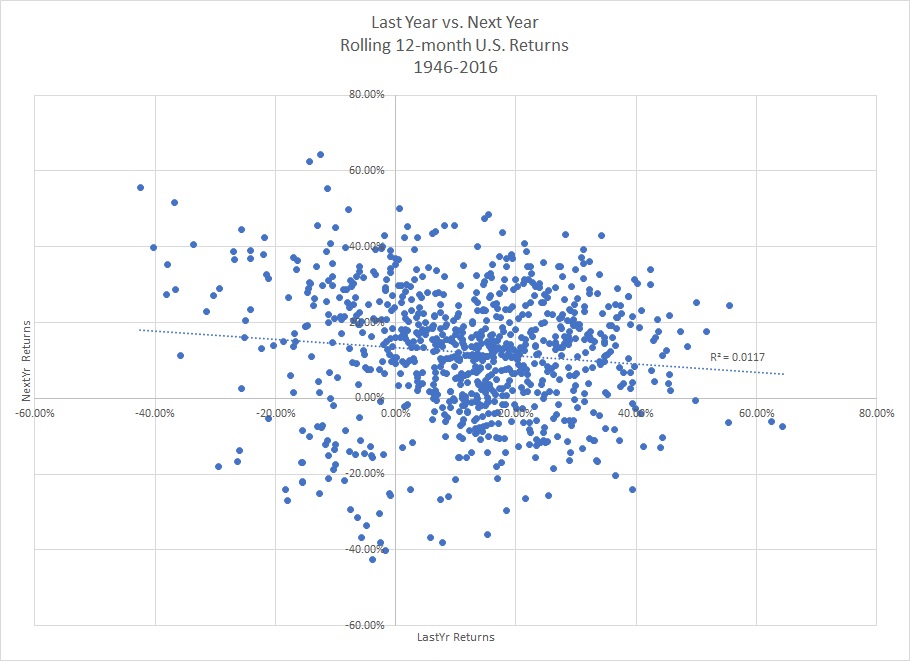
The 1930’s add a lot of the extreme values to the graph. Here it is again post WWII (starting 1/1946):

Still no real pattern. So, when you start feeling nervous because of how much the market is up or down recently, relax, it’s as unpredictable as ever going forward!
Seventh, U.S. Trust did an excellent graphic about the History of U.S. Bear & Bull Markets Since 1926.
Eighth, I have updated all the spreadsheets on my site that have market data and tweaked a few others. Here is the comprehensive list with links and brief explanations:
 Alpha for Confidence Spreadsheet – lets you see if a manager really has alpha (it’s generally just noise). Input the alpha, the standard deviation of the investment and the benchmark, the correlation of them, and the number of periods for which you have the data and it tells you how certain you can be that there is any alpha at all. Alpha for Confidence Spreadsheet – lets you see if a manager really has alpha (it’s generally just noise). Input the alpha, the standard deviation of the investment and the benchmark, the correlation of them, and the number of periods for which you have the data and it tells you how certain you can be that there is any alpha at all.
Black-Scholes Option Pricing Spreadsheet – used in our practice to figure out if employee stock options should be exercised prior to maturity. There is generally a trade-off because exercising early reduces risk, but it leaves money on the table – the time value of the option. Most advisors focus on the moneyness of the option and completely ignore the time value that is wasted.
Converting Arithmetic to Geometric Averages Spreadsheet – The difference between the arithmetic average (the average you learned in elementary school) and the geometric average (the compound return) is roughly half the variance. That is just one method of approximating it. Over one time-period your expected return is the arithmetic average, but over many periods it becomes the geometric average. This spreadsheet shows it graphically, and also shows for U.S. stocks since 1926 the actual figures and the estimates from various formulas. Updated annually with market data through the end of the previous year.
Duration Calculator for Stocks, Bonds, & Mortgages – calculates the duration of your mortgage, bonds, and also stocks (yes, you can calculate the duration of a stock). May be particularly useful for evaluating preferred stocks in anticipation of rising rates or seeing whether a portfolio of bonds duration matched to a mortgage might be better than paying off the mortgage itself.
Efficient Frontier Spreadsheet – lets you see the efficient frontier for a stock/bond mix historically and also with estimates of the future. You can look at it with returns in either real or nominal terms, arithmetic or geometric, and also risk in terms of either standard deviation (as is typically done today), variance (as was done by Markowitz originally), or by expected periodic losses (as would be meaningful to clients). Updated annually with market data through the end of the previous year.
Historical Market Downturns Spreadsheet – lets you specify the stock/bond mix, the historical time period, the magnitude of the drawdown, and whether you are interested in nominal or real returns. Shows the number of drawdowns that met your criteria, and the average and median durations of the declines. Updated annually with market data through the end of the previous year.
Improved Geometric Mean Function for Excel [syntax: mygeomean(range)] – I got tired in Excel of not being able to quickly get the geometric average return for a series of returns. So I sent myself to a visual basic class just to get this (and I have forgotten everything now). The function is =mygeomean(range) and it adds one to each return, takes the product, then the nth root and subtracts one. Voila, the geometric mean. If you have monthly returns and would like to know the annual geometric return just do this: =(1+mygeomean(range))^12-1
Investment Return Matrix Spreadsheet – a little hard to explain without you actually looking at it. It shows for any specified mix of stocks and bonds the historical returns with all the various start and end points on a heat map. Also lets you specify real or nominal returns. There are also a few charts showing how holding period affects the range of returns. The heat map itself is also printable (though the print is now pretty small). Updated annually with market data through the end of the previous year.
Joint Life Probability Spreadsheet – Uses the RP2014 annuitant tables to let you see the probabilities that a client (or a couple) will live to various ages. Gives the odds for each of the couple, both, and either (i.e. survivorship). Allows you to specify white- or blue-collar, top or bottom quartile, etc. Also a chart that displays the difference between men and women graphically and shows the negative skewness of the distribution. (In other words, it is a lot easier to die 50 years before your life expectancy than it is 50 years after.)
MCS Spreadsheet for Foundations – you have to get the riskamp add-in for Excel (they have a free trial) but then you can run Monte Carlo Simulations using the spending rules typically employed by endowments and foundations. Let’s you specify a starting withdrawal percentage and then (if applicable) the number of years to average and whether there is a ratchet employed.
MCS Spreadsheet for Private Clients – again you have to get the riskamp add-in for Excel (they have a free trial) but then you can run Monte Carlo Simulations for clients (or yourself). There is a brief guide here than may be of help.
One-Person Retirement Plan Comparison Spreadsheet – allows easy comparison of solo 401(k) plans, SEPs, and SIMPLEs. Works for both pass-through entities and corporations.
One-Person Social Security Breakeven Spreadsheet – this is one of the oldest spreadsheets on the site. It isn’t fancy, but since delaying social security is similar to buying TIPS (gov’t guaranteed, inflation adjusted) it lets you test what the breakeven age is at various points. I haven’t built a spreadsheet calculator for married couples or with the various claiming strategies because 1) it’s very complicated, and 2) there are a number of purveyors of that type of software already.
Pension for C-corp v. SE Spreadsheet – it occurred to me a while back that for low incomes the lack of taxation of the employer contribution to a pension is valuable but as the income increases it goes the other way. In this I assume all income is either paid in FICA taxes, pension contribution, or pay to the owner so there are no corporate income taxes to muddle the comparison.
Pension Option Analysis Spreadsheet – Calculated the NPV of various pension options a retiree may be offered. For example, which is better the life-only or the 50% J&S? What about life only but hedging the risk with life insurance? This incorporates the RP2014 annuitant tables to find the answer without guessing.
Russell Indexes Spreadsheet – lets you compare and contrast 9 different Russell Indexes (the basic and growth and value versions of the 1000, 2000, and 3000) to see how certain it is that (based on the Russell history) that small value really beats small growth for example (73.8% chance). Similar to the Alpha for Confidence spreadsheet above, but with data already there to fiddle with.
Stock Market Trend Spreadsheet – charts (and data) showing the long-term trend of the market. There is no reason the market has to follow the trend going forward of course, but still interesting. Allows you to look at stocks, bonds, and inflation both real and nominal.
Stocks vs Bonds Spreadsheet – similar to the Russell Indexes Spreadsheet above, but has stocks (CRSP total market) vs. bonds (Barclay’s aggregate). Based on this data there is a 95.53% chance that stocks really do beat bonds. (Of course we have lots of other evidence and reasons they should too.)
Tax Consequences of Renting vs. Homeownership Spreadsheet – I built a little model to figure out what the difference would be if instead of buying a home you rented one. In other words, suppose you and a friend each bought a home but instead of living in it you each rented to each other. The total expenses are the same but move above the line (taxes, interest, insurance) or are brand new (depreciation), on the other hand, you no longer get the section 121 deduction (the $500k MFJ/ $250k not MFJ exclusion of gain on sale). I was curious which strategy was better and by how much, but it can also be used to compute the IRR of a potential real estate investment.
Tax Treatment Comparison Spreadsheet – many years ago I got into a debate with a variable annuity proponent about a taxable account vs. an annuity and I didn’t like the simplifying assumptions he was making (100% annual turnover of the taxable account, really high returns, etc.) It turned out to be very complicated to model correctly (and even harder to justify the annuity when done correctly). There is a very limited place for variable annuities if someone has ordinary income property that would otherwise be held in a taxable account and the annuity “wrapper” is inexpensive but other than that it really doesn’t make much sense to me. This lets you compare IRAs, Roths, Annuities, Non-deductible IRAs (which is just an annuity with no expenses), and a taxable account. The most favorable situations for the annuity may not be what you would think. The “winning” investment is shown for each year.
 Ranked Asset Class Returns – this isn't a spreadsheet, but rather my version of what a is variously called the “periodic table of investments”, the “investment quilt”, etc. Ranked Asset Class Returns – this isn't a spreadsheet, but rather my version of what a is variously called the “periodic table of investments”, the “investment quilt”, etc.
Ninth, A reporter inquired about where to save emergency funds. My response:
Folks who are “good” with money may not need an emergency fund. In other words some people’s lives are more crisis-prone than others; some people seemingly have crises every other Tuesday while others (we have clients like this) have an emergency fund that hasn’t been touched in many years if not decades. Given today’s low interest rates, having an emergency fund with a low probability of actually needing it is expensive insurance. On the other hand, everyone does need a source of emergency liquidity.
So for those squared-away people (who frequently also have no debt) we recommend taking out (but not using) a HELOC. Obviously people who are bad with money (and they are frequently the folks with all the emergencies) will see the HELOC as another source of funds to blow on “emergency” vacations and new cars. People who are good with money will just leave the line open as a contingency.
Let me elaborate with a mathematical example. Suppose someone has $50,000 in an emergency fund and will need it on average 10% of the time (all $50,000 one year out of the ten or $5,000 on average all the time, it is mathematically equivalent). They also have a 30-year mortgage. Per Bankrate.com average money market rates are 0.11% while 30-year mortgage rates are 4.01%. So the emergency fund earns 0.11%*$50,000*90% (10% of it is withdrawn on average and thus doesn’t earn interest) or $49.50 while the interest cost on the mortgage is $50,000*4.01% or $2,005 for a net cost of $1,955.50. If this individual instead took the $50,000 and paid down their mortgage and then tapped a HELOC as needed, on average the balance on the HELOC would be $5,000 at a rate of 4.56% (Bankrate.com again) or $228. So in my simple example the savings is $1,727.50 per year.
To break even, using the figures in the previous paragraph, the HELOC would have to be tapped for the full amount about 88% of the time (or tapped at 88% of $50,000 100% of the time)!
Tenth, the latest Credit Suisse Global Investment Yearbook is out.
Eleventh, Larry Swedroe had lessons from 2016. The whole piece (here) is worth a read, but the main points were:
- Lesson 1: Active Management Is a Loser’s Game
- Lesson 2: So Much of Returns Come in Very Short and Unpredictable Bursts
- Lesson 3: Events Occur That No One Predicted
- Lesson 4: Ignore All Forecasts; All Crystal Balls Are Cloudy
- Lesson 5: Even With A Clear Crystal Ball… [knowing future political or economic events won’t necessarily help you invest wisely]
- Lesson 6: Last Year’s Winners Are Just As Likely To Be This Year’s Dogs
- Lesson 7: “Sell in May and Go Away” Is the Financial Equivalent of Astrology
- Lesson 8: Hedge Funds Are Not Investment Vehicles, They Are Compensation Schemes
- Lesson 9: Don’t Let Your Political Views Influence Your Investment Decisions
Twelfth, this is slightly wonkier than what I normally distribute, but it makes a good point. It is entirely possible that low interest rates really are the “new normal” and won’t revert to a higher level for a long time (if ever) and that is important to note and use in setting client expectations. Spreads to risky assets will probably be similar though. From table one of the Global Investment Returns Yearbook (previous item in this list), we see that on a global basis (so we don’t over-extrapolate from the US) from 1900-2016 equities returned 5.1% real, bonds returned 1.8% real, and bills returned 0.8% real (and inflation was 2.9%). If there is a “new normal” I would probably lower all of those roughly 1% (so the expected nominal returns on stocks would be approximately 6% [(5.1 - 1.0) + (2.9 - 1.0)]). The possible explanation is that as capital is more abundant and/or less risky now it should earn lower returns. In other words, there is vastly more accumulated global capital now and the world (particularly the investment world) is a much safer place, so it isn’t reasonable to expect the same returns as when those things were different.
Thirteenth, in the category of fake news, in Barron’s a few weeks ago they printed a Buffett quote from a recent interview, “Stocks actually are on the cheap side compared with historic valuations.”
That shocked me as I have no idea how that could be right. (And Uncle Warren isn’t an idiot.) But what is really true is you should never trust journalists not to take a quote out of context. Here is the actual quote from the CNBC interview: “Measured against interest rates, stocks actually are on the cheap side compared to historic valuations. But the risk always is interest rates go up, and that brings stocks down.” Now that I think is right. At the very least they should have started the quote with an ellipsis (they didn’t).
Fourteenth, I read a pre-publication paper that we should pay attention to – because we are all (me included) prone to confirmation bias and this paper argues against some strategies we use pretty heavily (DFA & AQR value strategies). I don’t have a firm conclusion about the findings yet, my initial reaction is that while formulaic value investing might not be statistically significant in the recent period cited 1) the premium was still in the right direction, so still “worked” just not statistically significant, and 2) you would expect with fewer periods to get less significance (i.e. you wouldn’t expect to look 12 months of data for example and get statistical significance). It does appear (and this isn’t a new conclusion) that a great deal of the value effect is from not owning very expensive small stocks (what I refer to as “lottery-ticket stocks”) rather than from owning cheap stocks. (Just like people buy lottery tickets with a negative expected return because they like positive skewness – the potential of riches – even more, the same is true of many small growth companies and “story stocks.”) The authors do make a good point that if you do own those expensive stocks you can earn some additional money from fees paid for lending them to short-sellers. The historical backtests would pick up the poor returns without the offsetting lending fees. Thus the terrible performance of those stocks is mitigated somewhat.
It strikes me there is a continuum of value investing exemplified by Warren Buffett’s evolution over time:
- Cigar Butt Investing – this was Ben Graham’s approach, find stocks with liquidation values below the market value. In other words, in the case of bankruptcy you made money! Those don’t exist today and haven’t for some time. These going away roughly coincides with Warren shutting down his partnership in May 1969. This type of value investing still exists in limited fashion. For example, some active (and activist) investors who buy distressed debt with an eye toward restructuring in bankruptcy.
- Low-Growth Investing – buying boring, stodgy, unsexy, yet cheap companies. This would in large part be a high-dividend-yield strategy. Investors tend not to be very enthusiastic about boring stories or companies going out of business slowly (Sears?) so might undervalue the present value of the expected dividends. This is Warren buying insurance companies and railroads.
- GAARP Investing. This is Warren buying companies with “moats” and high profitability (Coca-Cola for example) even when the price doesn’t seem cheap from an earnings or book value perspective.
Formula investing (mechanical price/fundamentalX strategies) pick those up in different ways. Price-to-book would pick up the first one and price-to-earnings the second. Adding a profitability measure probably picks up the third.
Fifteenth, I was reading an article about how hard it is to stamp out erroneous beliefs in the medical profession. (As physicist Max Planck said, “A new scientific truth does not triumph by convincing its opponents and making them see the light, but rather because its opponents eventually die, and a new generation grows up that is familiar with it.” His statement is usually rendered more pithily as, "Science advances one funeral at a time.")
Anyway, I queried a few of my peers that I respect to start a discussion about what we are doing as financial advisors that is the equivalent of putting in stents. Here is my synopsis of the responses (not stealing credit, the thoughts here are mostly not mine originally). I realized there are actually three categories of things:
- The original question was us doing something even though not optimal (analogous to a doctor putting in a useless stent). Example:
- overtrading in a taxable account because of insufficient attention given to the long-term tax consequences
- Similar, but slightly different category, is letting clients do things that are not optimal. Examples include “letting” them (i.e. not fighting them hard enough on):
- Spending/savings rates
- SS early claiming
- Active management version 1: using active investment managers who attempt market-timing or stock-picking
- Active management version 2: the client attempting to market-time (capitulation at market extremes for example) or stock-pick
- An opposite issue is not recommending things that we should be recommending
- immediate annuities (not an issue right now IMHO because of how low rates are, but will be if rates rise to “normal” levels)
- benchmark hugging to reduce tracking error (part of this is related to the overtrading mentioned in 1a, there is overtrading to stay close to the target asset allocation, but there is a separate issue with not using some asset classes or using them in smaller weights – i.e. being underweight anything not U.S. large cap or agg just so you don’t have to explain it to the client)
Sixteenth, Dan Solin had Ten Headlines You’ll Never See in the Financial Media.
It would be great if the financial media conveyed useful information to investors. If it did, you’d see headlines like these:
- Our advertisers pay us to provide “news” that enriches their bottom line at the expense of yours.
- Our “experts” are no more accurate in their predictions than the flip of a coin.
- It would be more accurate to call “predictions” by our experts “random guesses.”
- We don’t have a clue where the market is headed and neither does anyone else.
- When you trade, it’s likely an institution is on the other side. We don’t like your chances.
- It makes no sense to buy individual stocks.
- Even if it did, we have no way to identify stocks likely to outperform in the future.
- Overweighting your portfolio in gold is dumb, no matter how frightened you are.
- If bouncing in and out of the market made sense, professional managers would not have such a terrible track record.
- You’d be better off not watching or reading us.
Finally, my recurring reminders:
J.P. Morgan’s updated Guide to the Markets for this quarter is out and filled with great data as usual.
Jonathan Clements, Morgan Housel, and Larry Swedroe, all continue to publish great stuff. Just a reminder to go to those links and read whatever catches your fancy since last quarter.
That’s it for this quarter. I hope some of the above was beneficial.
Addendum:
If you are receiving this email directly from me, you are on my list of Financial Professionals who have requested I share things that may be of interest. If you no longer wish to be on this list or have an associate who would like to be on the list, simply let me know.
We have clients nationwide; if you ever have an opportunity to send a potential client our way that would be greatly appreciated. We also have been hired by some of our fellow advisors as consultants to help where we can with their businesses. If you are interested in learning more about that arrangement, please let us know.
We also offer a monthly email newsletter, Financial Foundations, which is intended more for private clients and other non-financial-professionals who are interested. If you would like to be on that list as well, you may edit your preferences here.
Finally, if you have a colleague who would like to subscribe to this list, they may do so from that link as well.
Regards,

David E. Hultstrom
770-517-8160
Disclaimer: The information set forth herein has been obtained or derived from sources believed by author to be reliable. However, the author does not make any representation or warranty, express or implied, as to the information’s accuracy or completeness, nor does the author recommend that the attached information serve as the basis of any investment decision. This document has been provided to you solely for information purposes and does not constitute an offer or solicitation of an offer, or any advice or recommendation, to purchase any securities or other financial instruments, and may not be construed as such. |