|
This is my quarterly missive intended primarily for my fellow financial professionals wherein I share items I have run across or thought about this quarter which I think might be beneficial to you. Enjoy!
For the rest of 2018 I have seminars for CPAs scheduled (through Surgent) in Georgia (Atlanta and Duluth), and North Carolina (Greensboro, Charlotte, and Morrisville).
I would love to see you at one of those sessions, and if you are looking for a speaker at your professional conference or event, please feel free to contact me for more information.
First, a few good quotes I came across:
Think of your beliefs like clothing, not tattoos. – Nick Maggiulli
Wealth, in fact, is what you don’t see. It’s the cars not purchased. The diamonds not bought. The renovations postponed, the clothes forgone and the first-class upgrade declined. It’s assets in the bank that haven’t yet been converted into the stuff you see. – Morgan Housel
Mild success can be explainable by skills and labor. Wild success is attributable to variance. – Nassim Taleb
What you should learn when you make a mistake because you did not anticipate something is that the world is difficult to anticipate. That’s the correct lesson to learn from surprises: that the world is surprising. – Daniel Kahneman
“Slow” failure results from taking too little risk, while “fast” failure results from taking too much risk. – Justin Sibears
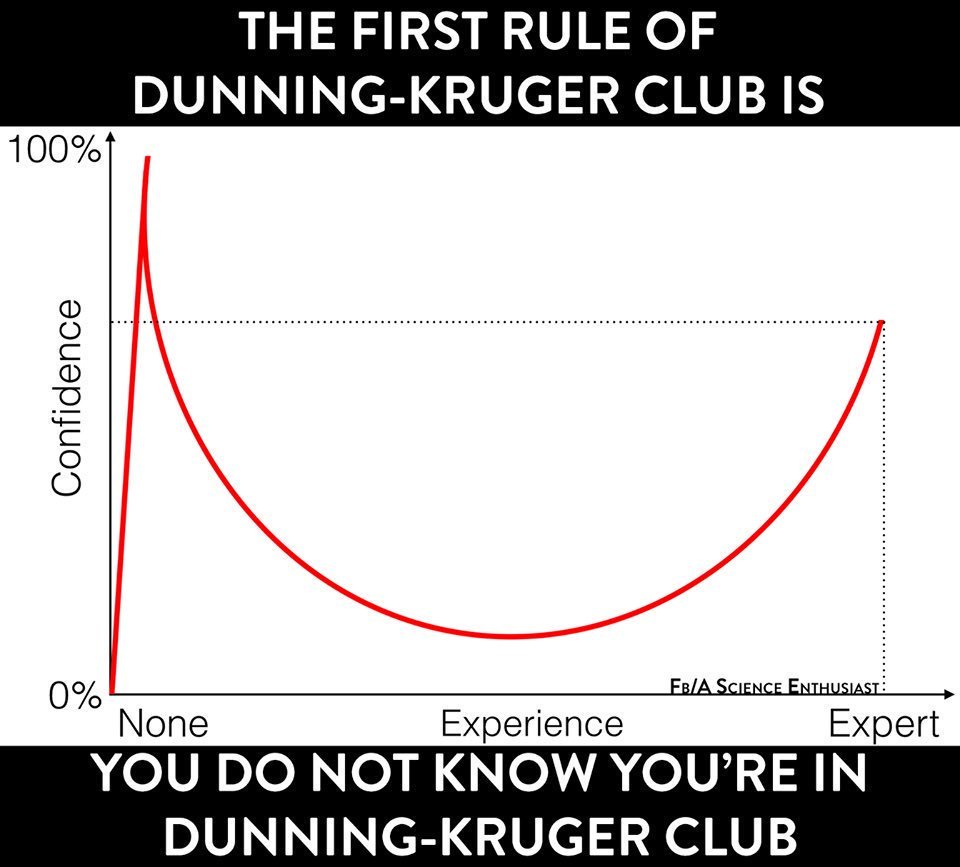
Second, I mentioned the Dunning-Kruger Effect last quarter and there was some interest, so I thought I would share some additional info:
- The original paper is hard to locate free online, but it is here.
- Also, Pacific Standard did a good article on it here.
- Finally, Wikipedia, of course, has it here.
Unfortunately,
Third, I got an email from a client who saw this and was worried. My reply:
Good question. Observations:
We do know that expected returns on stocks are low, but so are expected returns on bonds. The difference (the “equity risk premium”) still appears reasonable for the risk.
(Also, note that Business Insider tends to have a lot of hyperbolic “clickbait” stories.)
Fourth, one of my consulting clients asked me to talk about international investing at their next investment committee meeting. I made it a blog post here.
Fifth, NBER published a paper with a broad overview of financial mistakes people make here.
Sixth, the excellent Jonathan Clements wrote: “I have spent much of my investing career expecting five key financial trends to play themselves out—and yet they’ve stubbornly refused to do so.”
His five things are:
- Stock valuations (too high)
- Interest rates (too low)
- Inflation (too low)
- Taxes (too low)
- Retirement Savings (too low)
My approach on the first four is to realize that the future is unknowable, but I believe the best estimate of stock valuations, yield curves, inflation, and taxes is the current level. I don’t assume any reversion to the mean, etc. (but neither will reversion – or the opposite – surprise me).
On the fifth, I agree they are too low, but that is controllable by the client, so they should simply raise their savings rate. Retirees who don’t do so will simply have a lower standard of living in retirement than they prefer, but most everyone has a lower standard of living than they would prefer! That is not the same thing as pensioners starving in the streets.
Seventh, Larry Swedroe had an excellent piece on discipline.
Eighth, I don’t think most advisors realize the limitations of UTMAs – and the dangers of not respecting those limitations: If You Spend Your Child’s UTMA Money, You’re Probably Breaking the Law
Ninth, I don’t think most advisors realize the complexity of taxes with non-U.S. people or with putting IRAs in trusts. Trusts & Estates magazine (July issue, behind a paywall unfortunately) had some good reading – not to learn the strategies necessarily, but to get a feel for just how complicated it is and how easy it would be to give poor advice.
- Taxes and non-US people pages 20-27
- IRAs in trusts pages 28-33
(I can’t find the exact quote or remember who said it, but the gist was it is frequently more productive to read adjacent to your field rather than in your field – presuming you are reasonably knowledgeable in your field already. Anyway, I agree with that thought and that is why I read Trusts & Estates.)
Tenth, Uncle Warren from 1985 (plus ça change, plus c’est la même chose).
Eleventh, this is my wish list for financial institutions (some might need some lobbying of Congress to do).
From lenders:
- Given the new tax bill we have all given thought to bunching charitable contributions. But what about mortgage interest? What if a financial institution offered a product that had balloon payments of interest rather than principal on a periodic basis? In other words, have x years of payments that are just principal (with interest accruing) and then in the x+1 year the payments would be all the accrued interest and little or no principal.
From insurance companies:
- A term insurance policy that terminates with $1 of cash value – so I can do a 1035 exchange to an annuity and use the total premiums paid as basis for tax-free growth.
- An LTC policy with an elimination period several years long – so it is cheap insurance against catastrophe. I don’t need coverage for the first year or two (or three), I need the back end.
From investment product providers:
- A non-investment-grade sovereign bond fund – why do I want an emerging market bond fund that is a combination of investment grade and non-investment grade? Give me a pure play!
- Synthetic securities for shorting – to sell something short, you currently need three parties: 1) a lender of the security, 2) the short seller, 3) the buyer from the short seller. There is no need for the first party and a shortage of securities to borrow leads to mis-pricings that persist. Why can’t I be short and someone else long without having to borrow the security? There would be no voting rights and no qualified dividends for the buyer, but I would imagine most people wouldn’t care (the lender already loses both of those now and nobody seems to notice).
- Since futures contracts are taxed 60% LTCG and 40% STCG, why doesn’t a mutual fund company come out with a fixed income index fund (based on the agg for example) that invests in futures? In other words, is there a reason a company can’t create a better bond index fund designed to be held in taxable accounts by using futures as the investment instead of the actual bonds? At higher interest rate levels, it seems like that would be compelling.
From custodians:
- Annuity accounts – I can open an IRA/SEP/SIMPLE/Taxable/etc. on a custodian platform and buy whatever I want in them just paying a transaction fee. Why can’t a variable annuity be that easy? In other words, it should look to me just like another account (though it would have an annual fee or something for the insurance, but that is cheap). I don’t want any riders, etc. just a plain vanilla annuity that I can trade in, and debit my fee from, just like any other account. The key part is the ability to debit the client fee and it not be considered a distribution.
- A reasonable spread on cash rates – at Schwab the sweep account currently earns 22 bps and the margin rate (up to $25,000) is 932.5 bps. A spread of over 900 bps seems a little excessive considering the margin loan is essentially risk-free.
- A “fee-only” custodian – advisors are using less-conflicted business models where they don’t get kickbacks, why can’t the custodians do the same? No payments for order flow, no payments to be on NTF platforms, etc. (Michael Kitces has been on this as well.)
Twelfth, there was a good list of valuation metrics in the WSJ.
I look at Household Equity Allocation, Tobin’s Q, CAPE and a little bit at PE (the 1st, 4th, 7th, and 8th metrics on the list).
In times of “crazy” (late 1990’s) I would also look at P/S and P/B.
I give essentially no weight to the Dividend yield and Buffett indicator.
Thirteenth, this is about expert witnesses and credibility, but I think it apples to financial professionals too.
Fourteenth, bitcoin explained: “imagine if keeping your car idling 24/7 produced solved Sudokus you could trade for heroin”
I am a fan of blockchain technology, but the currency aspect I think is aptly described by that analogy.
Fifteenth, I have been reading up on the mortgage interest deduction to have a better feel for what might happen with it going forward. I highly recommend two papers if you are interested as well. This one is the history, and this one is a proposal for change that I think may get some traction in the relatively near future (prior to 2025).
Sixteenth, there was a long discussion about equity indexed annuities on the FPA message boards and I weighed in. Thought you might be interested in what I posted:
There are a few topics that generate more heat than light in any diverse (by business model) group of advisors, and annuities vs. taxable accounts are one of them. (The others are fees vs. commissions, permanent vs. term insurance, and active vs. passive management.) Thus, I generally don’t participate in discussions on those topics, but I’m going to make an exception to my rule since this thread has stayed much more civil than I would have expected. (Though Godwin’s Law probably still holds.)
There are clear cases where a life annuity (or a QLAC) can improve average outcomes by hedging longevity risk. This is because the risks (longevity) are uncorrelated and thus can be pooled and thus risk reduced. (The QLAC also essentially pushes RMDs back which may be helpful as well from a tax perspective.)
There are clear cases where a cheap, plain-vanilla, variable annuity wrapper (no riders) can improve average outcomes by reducing taxes. (If your portfolio should include ordinary income investments such as REITS, bonds, etc. and the yield is high, ordinary income rates are high, and there is no “room” in a tax deferred account for these holdings, holding them in a variable annuity can make sense.)
So in those two cases, IMHO, annuities can be appropriate because the advantage to the client comes from risk pooling or tax reduction. Index annuities do not have either of those advantages (in fact you are usually making the taxes worse by turning a capital gain, with possibility of step-up, into ordinary income that is IRD).
Index annuities, despite their legal definition, are not insurance at all. We can see this by recognizing that as an insurance company sells more of these policies their risk increases rather than decreases – this is different from every other insurance product that I can think of.
In other words, an insurance company doesn’t want to sell 10 individual billion-dollar life insurance policies they would rather sell 10,000 million-dollar policies. Even though the total face amount is the same the risk of the 10 policies is too high for the company to bear. (And even those 10,000 will have exclusions for things like acts of war that would cause risks to become higher and correlated.)
Similarly, a P&C company doesn’t want to write insurance just in Miami, they would much prefer a geographically diversified portfolio so one hurricane doesn’t wipe them out.
With market guarantees all the bets are correlated. The market goes down for everyone simultaneously. Thus, the insurance company simply cannot take the risk. There is no risk pooling available. The only way to offload it is by not investing in the market.
As other folks in this thread have observed, you are really buying fixed income. That is all the insurance company can really do. Buy why add the complexity, opacity, expenses, etc. of an insurance contract to the underlying fixed income portfolio? Why not just buy it directly?
As Milton Friedman (among many others) observed, TANSTAAFL. The investor should simply admit they are investing in fixed income and just buy it directly instead of complicating it to pretend they have stock exposure.
Three final points:
First, although I am sure they exist (possibly among the readers of this), I have never seen anyone who sold one of these do their own back-test (in Excel, for example) of how the contract would have performed historically. I am a firm believer that if you don’t understand it well enough to model it (at the very least a range of historical returns!), you shouldn’t recommend it.
Second, you will frequently find in the fine print that the insurance company reserves the right to change the terms of the deal after the fact if they are losing money. The last thing I want is “insurance” that becomes much less valuable just when it is needed most.
Third, on average, purchasers of insurance lose money. This is because on average insurance companies are profitable. That isn’t to say you shouldn’t buy insurance, it is just to say you should recognize that you are losing money (though possibly saving taxes in some cases) when you do so.
Seventeenth, you may have seen a lot of specious pontificating about the “record” elapsed time since we have had a 20% correction. All of it ignoring dividends – but wouldn’t people care if their account value was down more than 20% rather than just some market average? There is also a kerfuffle about whether to use intraday data or closing prices (the clock got reset three years ago if using intraday), but I think we should even ignore intramonth because most people (at least historically) only looked at their monthly statements – and because I have monthly data!
Using monthly total return data on the total U.S. stock market (CRSP 1-10), we have had 8 drawdowns of at least 20% since 1926. Following each low, the elapsed time to the next 20% down from the high was:
- 7/32 to 8/46, 170 months
- 6/47 to 5/62, 180 months
- 7/62 to 12/69. 90 months
- 7/70 to 3/74, 45 months
- 10/74 to 9/87, 156 months
- 12/87 to 1/01, 158 months
- 10/02 to 8/08, 71 months
- 3/09 to 7/18, 113 months and counting
So this “longest rally in U.S. history” … isn’t really. We would need about 5½ more years for that. And it’s only #5 out of 8 – not even in the top half!
The point is, if small changes (daily close to monthly close, and from price only to total return) affect how remarkable the event is by that much, maybe the data isn’t meaningful?
Eighteenth, as I’m sure you saw, proposed regs shut down the SALT deduction work-around.
Nineteenth, as most of you know, in our model portfolios we are overweight TIPS compared to most advisors. (I, however, think of it as most advisors unintentionally being very short unexpected inflation.)
For a client with typical inflation exposures we have neutral inflation exposure in our fixed income allocations – in other words we have half in TIPS and half in nominal bonds. Some clients have positive exposure to inflation (e.g. real estate investors with substantial long-term, fixed-rate, financing) and some have negative exposure to inflation (e.g. folks with large pensions that have no COLAs) in which case we would adjust the ratio of TIPS to nominal bonds accordingly.
If inflation is higher (lower) than expected, TIPS will outperform (underperform) and nominal bonds underperform (outperform). Thus, clients will be unaffected by either outcome in the fixed income portion of their portfolios. Remember, low-quality advisors (who typically have less wealthy and less sophisticated clients) mostly bet (i.e. position portfolios for what they believe will happen), high-quality advisors (who typically have wealthier and more sophisticated clients) mostly hedge (i.e. position portfolios for what can happen).
Twentieth, one of the major fund companies (which we use despite the following) uses a very limited definition of value (price-to-book), despite being prodded to do something more robust. (Their response has been that price-to-book has worked the best, which 1) isn’t true, and 2) is still overfitting the model to the data even if it were.)
There are 5 different accounting items commonly used (when compared to price) to derive a measure of value of a stock. These items come from three different financial statements:
- Balance Sheet
- Book Value
- Statement of Cash Flow
- Cash Flow
- Dividends
- Income Statement
- Sales
- Earnings
I want to take those one at a time and mention some relevant issues.
- Book Value issues:
- Depreciation schedules rarely match economic change in the value of the asset.
- Inflation can wreak havoc on these values (not a big issue right now).
- Advertising is expensed but, if done well, adds enduring value to the brand (e.g. Coca-Cola).
- R&D is expensed but, if done well, adds enduring value.
- Acquisitions that work out cannot be increased in value on the balance sheet, but those that go wrong are written down (Google’s balance sheet doesn’t reflect the real value of buying YouTube).
- If a company is a going concern (i.e. not going bankrupt) the book values aren’t relevant. In bankruptcy the (accurate) value of the assets and liabilities are very relevant.
- Cash Flow issues:
- High growth rates can cause apparent cash flow problems, but this is a good problem.
- High levels of debt can impair cash flow, but the problem isn’t (necessarily) the company, it is the capital structure.
- Dividend issues:
- The company may not pay dividends (or low dividends) because of attractive opportunities to grow. Do you want Warren Buffett to pay a dividend or invest it for you? (not a great example right now, but historically …)
- The company may be slowly liquidating to pay the dividend. In other words, if a company is selling divisions over time to generate the cash to pay dividends this isn’t a good sign (it isn’t sustainable).
- The company may be increasing leverage (issuing debt) the proceeds of which are used to pay dividends. This may or may not be good, but it certainly makes the dividend yield a misleading metric.
- There seems to be a tendency for management to waste some of the value of internally generated cash flows. Dividends may discipline management. Alternatively, dividends may be a sign that management is focused on their owners rather than mere empire building. Those are both good things. Research shows that dividends are the worst way to measure value, all the information in the dividend yield is captured (subsumed) by the other metrics.
- Sales issues:
- The higher up the income statement the “purer” the metric and sales is at the top which is good, but…
- Sales can be increased (dramatically!) by easy credit terms. In other words, it is easy to sell a great deal to people who never intend to pay.
- Sales can be increased (again, dramatically!) by selling at a loss. If you sell dollars for fifty cents I predict both incredibly high sales and eventual bankruptcy.
- On the other hand, it is easier to turn sales into profits than to create sales from scratch. For example, Tesla is worth more than a local bicycle shop even though the local bike shop might be profitable. This is because there is hope (perhaps misplaced) that the sales can be turned into earnings. Amazon is a great example here too. Sales are enormous, profits not so much – so far.
- Earnings issues:
- Running down inventory will increase short-term earnings – particularly if using LIFO when prices have increased over time.
- Selling on lenient credit will increase apparent earnings (even if the bills are not paid).
- Reducing spending on most everything (R&D, maintenance, advertising, customer service, etc.) will increase short-term earnings, but may be fatal to the business in the long run.
- Depreciation expenses may make earnings look lower than they really are if depreciation isn’t appropriately tied to the actual decline in value. For example, in a high inflation environment, the nominal value of PP&E may be increasing at the same time depreciation charges are being booked.
- Not expanding (even when prudent) can increase short-term earnings. For example, running at 100% of manufacturing capacity may maximize earnings right now (assuming all the widgets can be sold), but building another plant would probably be prudent if the company is growing sales. But ramping up another facility will probably reduce short-term earnings.
- Selling assets that are on the books at low values will increase earnings, but not operating earnings.
- Higher than optimal levels of debt will depress earnings, but the underlying company may be fine if the capital structure were more appropriate.
So, as you see, using any one metric has the potential to be very misleading. A blend of all of them is vastly preferable. You could leave out book value for going concerns, and dividends as being subsumed by the other metrics, but it probably won’t matter a great deal. On the other hand, using book value or dividends exclusively as your value measure is probably a sub-optimal decision.
Twenty-first, I have been harping on this for a long time: IMHO, successful people have long time horizons and low discount rates. Both of those are just different ways of saying they delay gratification. A new paper supports my thesis.
Twenty-second, there were a several articles about alternative investing recently:
- From Jonathan Clements, here on alternatives in general.
- From Cliff Asness, here on liquid alts.
- From Morningstar here and here also on liquid alts.
- From Bloomberg here on hedge funds. (h/t Barry Ritholtz)
Twenty-third, I recently had rotator cuff surgery. I made sure I had a young(ish) surgeon and an even younger physical therapist. This is a good explanation of why I prioritized that, specifically, this portion:
Research on doctors shows that even those who have been in practice for 20 or 30 years do worse on objective measures of performance than doctors who are just 2 or 3 years out of med school. Harvard Medical School published a study in 2005 on 62 different individual research reports on the standard of care provided by doctors and how it changes over time. Almost three-quarters of the studies found a doctor’s quality of care declines over time. Older doctors knew less and performed worse in terms of providing care than those who had fewer years of experience. Just 2 of the 62 studies found doctors got better with more years of service.
The assumption that med school, reading medical journals, and attending seminars when combined with years of experience should be enough to improve their skills doesn’t seem to hold for many doctors.
As Max Planck famously observed, “A new scientific truth does not triumph by convincing its opponents and making them see the light, but rather because its opponents eventually die, and a new generation grows up that is familiar with it.”
I wonder what we are missing as financial planners and investment managers that will be obvious to the next generation?
Along those lines, I have been reading The Structure of Scientific Revolutions (Amazon, PDF) to explore just this issue (that book is the source of the brilliant but hackneyed term “paradigm shift”) – but I’ll probably still miss the revolution happening right in front of my old eyes.
I’d like to think I won’t, but since most people would, and since I’m aware of the base rate fallacy, I’m not optimistic. (TL;DR summary of the fallacy: my case isn’t special, and neither is yours.)
Twenty-fourth, From Mitch Anthony (here):
Maybe, … we should start by telling clients what we cannot do before we tell them what we aim to do:
- I cannot predict the future.
- I cannot execute perfect timing (therefore, I’ll employ an all-weather strategy).
- I cannot beat indexes, averages and competitors year after year.
But …
- I can and will pay attention to your situation.
- I can and will adjust your approach according to your life needs.
- I can and will keep my word to you.
Twenty-fifth, I was having a discussion with a CFA colleague recently about volatility by measurement period and thought you might be interested in the data. He contended that you could simply annualize daily volatility by multiplying by the square root of 252 (the number of trading days in a year) or annualize monthly by multiplying by the square root of 12. I contended that those figures would be incorrect because of momentum in the data.
It was a friendly discussion because really, we are both right. It is different, but perhaps not material – depending on your definition of material. Anyway, I pulled the data to make sure my calibration was right about how different it was. This is historical data on the S&P 500 from Yahoo Finance, and as you can see the annualized compound returns match exactly (as it would have to) but the standard deviations do not.
|
Daily |
Monthly |
Annually |
Observations |
16861 |
804 |
67 |
Multiple |
251.66 |
12 |
1 |
Sigma |
0.96% |
4.12% |
16.53% |
Annualized |
15.25% |
14.26% |
16.53% |
Geo. Mean |
0.03% |
0.61% |
7.55% |
Annualized |
7.546% |
7.546% |
7.546% |
Daily returns are negatively correlated (over a few days) which brings down the monthly volatility, but monthly returns are positively correlated (over a few months) which raises the annual volatility – in other words, with monthly data you get trends which increase the volatility of the years. The magnitudes aren’t large, but it is noticeable in the data.
Twenty-sixth, When I get emails from wholesalers pitching stuff I have a standard response:
My rule, just to economize my time, is to not even consider anything pitched to me (I may find something in my own research that I would relax some of this for):
- That isn’t liquid (i.e. it must be actively traded on a major exchange or be a ’40 act fund).
- That doesn’t have a 3-year “live” public track record.
- That doesn’t have net assets over $100mm.
- That isn’t rules-based (i.e. passively managed).
- That has management fees over 75 bps.
- That doesn’t have a statistically significant t-stat.
If you meet all of those let me know and I will take a look, otherwise you can remove me from your distribution list. Make particular note of the last one. Folks think they have that when they really don’t. Please don’t make me go to the work of calculating it to check when you aren’t there. Thanks.
One responded recently to that with a “benchmark” and claimed an alpha of 4.65%. My response:
The peer group (I think) benchmark you used has 90% correlation. Russell 3000 is a better benchmark with 94% correlation. Of course your alpha to that is massively negative. Also, you can’t just multiply returns by 12 to annualized them if there is any volatility at all. Corrected spreadsheet attached. (The mygeomean function in there is one I wrote and is on my website if you want it, handier than manually adding one to all returns, taking the product, then the nth root, and subtracting one.)
Summary: Russell 3000 is 94% correlated and vs. that [your fund] has much lower return (bad), slightly lower risk (good), fatter tails (bad), more negative skew (bad, particularly with the fat tails).
I’m going to have to edit my list of criteria to specify index and not peer group. You are the second company to do that in a response.
Always use indexes, not peer groups. Since most managers underperform, if you use a peer group you may just be finding the tallest midget.
Also, if you are interested, for the fund above the corrected annual alpha vs. Russell 3000 was -5.86%. Based on the track record, there is a 99.97% chance that the Russell 3000 is better than their fund – and that’s the fund they are touting!
Twenty-seventh, there was a good article here comparing the “signature portfolios” of Bernstein, Swensen, Browne, and Swedroe. As noted in I thought my 50/50 TIPS/AGG fixed income was extreme but Swedroe is all-in on TIPS (and Swensen agrees with me, I didn’t know that).
I think the key point is that it really doesn’t matter too much how you allocate as long as:
- You broadly diversify between different asset classes.
- You stay invested through the inevitable downturns.
- You give it time.
Twenty-eighth, From the 2016 Federal Reserve Survey:
2016 Net Worth |
Age Bracket |
Median |
Average |
<35 |
$11,100 |
$76,200 |
35-44 |
$59,800 |
$288,700 |
45-54 |
$124,200 |
$727,500 |
55-64 |
$187,300 |
$1,167,400 |
65-74 |
$224,100 |
$1,066,000 |
>74 |
$264,800 |
$1,067,000 |
Pretty easy to be in the top half of the “folks” and not too hard to be above the average.
(The median is different from the average because positive skewness – it’s much easier to have a very high positive net worth than it is to have a very high negative net worth.)
Twenty-ninth, you should unbundle your investments – at least in taxable accounts.
For simplicity (and perhaps slightly lower transaction costs), people use things like balanced funds, asset allocation funds, target date funds, etc.
The problem with using these in taxable accounts is the loss of control over tax loss harvesting and strategic sales.
For example, suppose you buy a 60/40 balanced fund (like VBIAX). Several things could happen:
- The market could crash so the stocks decline, and the bond values rise (less than stocks decline, but still).
- The investor can’t just harvest the loss by selling just the stock portion so there is a real loss of efficiency.
- Tax loss harvesting is more difficult (and potentially more expensive in transaction costs) because the “replacement” (which might just be held for a month) would have to be multiple funds to match what was sold.
- The market could rise significantly (either suddenly or over time) and the bonds stay relatively flat.
- The investor needs funds to live on but can’t just sell the bonds. He or she would have to sell the stock portion as well and recognize the gain. If instead it was unbundled, it might be possible to reallocate funds in an IRA or similar vehicle without changing the overall allocation.
- The investor would like to make tax-efficient charitable gifts. It would be much better to be able to gift just the portion that had risen in value.
- The investor would like to gift to heirs in the zero percent capital gains bracket. Again, it would be much better to be able to gift just the portion that had risen in value.
- The investor who now has a short life expectancy would like to hold the highly appreciated securities for a step-up for the heirs but needs funds to live on in the short run. If there are multiple buckets, no problem, just liquidate the bonds, but again if it is all combined there is a real loss of efficiency.
Also, a related point. Because it is possible that a holding might be able to be held for a very long time (and maybe even get a step-up), I would pay a lot more attention to the odds of fee changes than people seem to do. For example, buying VTSAX at 4 bps appears more expensive than FZROX at 0 bps. But I have a lot more faith that the Vanguard will still be at a similar low price 20 years from now than I do the Fidelity option. In a taxable account you tend to get “locked-in” over time so it is more important to look at the issuer and be strategic more than tactical.
Also, there are a few folks on here using DFA funds. Their “core” and “vector” portfolios are just watered-down versions of their regular funds. But it is cheaper to use a blend. Here is the continuum of their US equity funds (along with a Vanguard Total US) with the expense ratios in parenthesis (in basis points):
- DFA US Small Cap Value I (52)
- DFA US Vector Equity I (32)
- DFA US Core Equity 2 I (22)
- DFA US Core Equity 1 I (19)
- Vanguard Total Stock Mkt Idx Adm (4)
The size and value tilts track in the same order as the expense ratios.
Let’s assume I wanted the exposure of the middle portfolio (Core Equity 2). If I regress it (just using Excel) against the Small Value and Vanguard’s Total Stock (the extremes), I can explain 99.5% of the monthly returns of Core Equity 2 by a combination of 27% Small Value and 75% Total Stock. Of course, I need to restrict myself to 100% total. So, let’s just call it 25/75. The CAGR of the mix is 9.21%. The CAGR of the Core Equity 2 is just 8.97%. So, I have improved returns by 24 bps! I don’t expect that going forward necessarily but I do know I can reduce my expenses from 22 bps to 16 bps (0.75*4+0.25*52). Ceteris Paribus lower expenses are obviously better. It’s only 6 bps, but what if years from now I am disillusioned by DFA and want to move my value tilt to another fund company but I’m still fine with Vanguard and the investments are in a taxable account? If there are large embedded gains, wouldn’t it be nice to only have to liquidate 25% of the position and only have the client exposed to tax on 25% (or so, depending on relative performance) instead of the whole thing?
Ignore Flo and unbundle people!
Thirtieth, I wrote a blog post on Signs of a High-Quality Advisor that I thought might be of interest to this group.
Thirty-first, when I wrote the blog post in the previous item, I realized I have never written up the optimal savings order (I did spending here).
The optimal savings vehicles are client-specific, both in what they may have available to them, and in what would be prudent for their specific situation. Nonetheless, in general, this is usually the right order (exceptions and other issues at the end) for a typical client who expects to be in a lower tax bracket in retirement than they are now:
- Tax-deductible, employer-based retirement plans (such as a 401(k) plan) to the extent of any match – a match just can’t be beat!
- For a married couple, priority of funding must consider:
- the better match
- the better investment options (but if the spouse with poor options is changing jobs soon it can be rolled over to an IRA, so it doesn’t matter as much)
- the longer deferral (the younger spouse will have lower RMDs in retirement if desired)
- HSA savings account – tax-deductible on the contributions and tax-free withdrawals (if used for medical expenses) later (ideally in retirement).
- Tax-deductible, individually-controlled retirement accounts (such as a traditional IRA) – broad investment options and generally more favorable “exceptions” if early withdrawal became necessary.
- For a married couple fund the younger spouse’s first.
- Tax-deductible, employer-based retirement plans (such as a 401(k) plan) from the match (see #1 above) to the limit.
- For a married couple, priority of funding must consider:
- the better investment options (but if the spouse with poor options is changing jobs soon it can be rolled over to an IRA, so it doesn’t matter as much)
- the longer deferral (the younger spouse will have lower RMDs in retirement if desired)
- Tax-free retirement vehicles (such as Roth IRAs).
- For a married couple fund the younger spouse’s first (this currently doesn’t matter, as there are no RMDs, but the law could change)
- If education funding is desired see College Funding.
- If tax-inefficient investments (such as taxable fixed income) will not fit inside the previous options on this list see Asset Location Strategy (the five items at the end).
- Taxable investments (regular brokerage accounts).
Important caveats and other comments:
- I have ignored liquidity needs in the list above. Of course, short-term liquidity may take precedence over some of the options listed and funding #5 (since original contributions can be withdrawn without penalty) prior to #2-4 might make sense. (Though probably not in place of #1.)
- I have ignored the “investment” opportunity of reducing debt. There may be behavioral and psychological issues that would impact the order, but from a purely financial perspective, there is low-rate (typically mortgage) debt and high-rate (typically consumer) debt:
- High-rate debt should generally be paid after #1, but it will depend on the specific situation. (Perhaps the client can both pay off the debt in a reasonable time frame and fund retirement vehicles. If they are going to max out the retirement plans every year going forward, they probably want to use them now too, not just after the debt is gone, since there is no “catch-up” when fully funding.)
- Low-rate debt should probably be paid down at #6 or #7 (in that order) if either is applicable.
- Investing in human capital (education or skills), particularly for a younger person, might be a better investment than many of the options above. (Though probably somewhere below #1.)
Finally, my recurring reminders:
J.P. Morgan’s updated Guide to the Markets for this quarter is out and filled with great data as usual.
Jonathan Clements, Morgan Housel, and Larry Swedroe, all continue to publish valuable wisdom. Just a reminder to go to those links and read whatever catches your fancy since last quarter.
That’s it for this quarter. I hope some of the above was beneficial.
Addendum:
If you are receiving this email directly from me, you are on my list of Financial Professionals who have requested I share things that may be of interest. If you no longer wish to be on this list or have an associate who would like to be on the list, simply let me know.
We have clients nationwide; if you ever have an opportunity to send a potential client our way that would be greatly appreciated. We also have been hired by some of our fellow advisors as consultants to help where we can with their businesses. If you are interested in learning more about that arrangement, please let us know.
We also offer a monthly email newsletter, Financial Foundations, which is intended more for private clients and other non-financial-professionals who are interested. If you would like to be on that list as well, you may edit your preferences here.
Finally, if you have a colleague who would like to subscribe to this list, they may do so from that link as well.
Regards,
David
Disclosure
|